How Watchman Tower Uses Real Response Time Monitoring to Reveal True Website Performance
- Watchman Tower Team
- Updated: July 19, 2026
- Category: Response Time Monitoring
- Read Time: 1 min
Response time monitoring matters because systems can be technically up while functionally frustrating. This guide shows why latency belongs inside a broader health view.
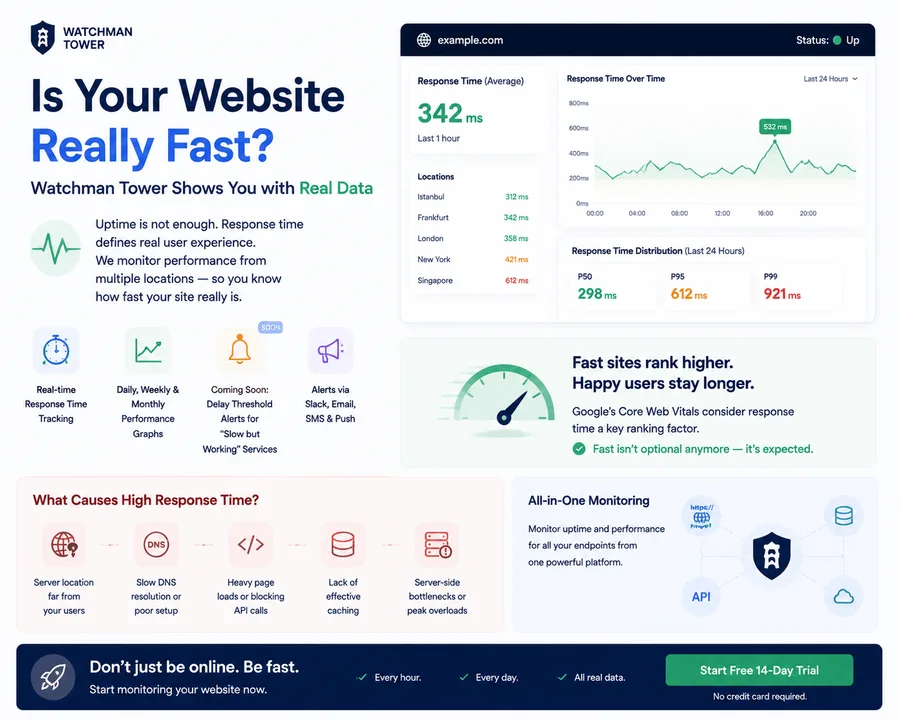
Is Your Website Really Fast? Watchman Tower Shows You with Real Data
Your website may be online — but how fast is it responding?
Response time is the heartbeat of user experience. At Watchman Tower, we go beyond uptime to answer that question with clarity — using real monitoring data from our own infrastructure.
What Is Response Time, and Why Does It Matter?
Most systems only ask: “Is it working?”
The real question is: “How many milliseconds does it take to work?”
A service can be up and still feel broken if it responds too slowly. High response time leads to user drop-off, poor SEO performance, and frustrated developers.
Google’s Core Web Vitals also weigh response time heavily in search rankings. Fast isn’t optional anymore — it’s expected.
What Causes High Response Time?
- Server location far from your users
- Slow DNS resolution or poor domain setup
- Heavy initial page loads or blocking API calls
- Lack of effective caching
- Server-side bottlenecks or peak-time overloads
Being online is one thing. Responding quickly is another.
📚 Related: How Slow Is Too Slow?
Want to understand when slow becomes a real issue?
Check out our previous blog post: How Slow Is Too Slow — When Your API Is Technically Fine but Functionally Broken
What Watchman Tower Offers
- Real-time response time tracking
- Daily, weekly, and monthly performance graphs
- Coming soon: Delay threshold alerts for “slow but working” services
- Alerts via Slack, Email, SMS, and Push
- Centralized monitoring for all endpoints
Final Thoughts
You don’t need a separate test tool to know your response time. Watchman Tower does it for you — every hour, every day.
Start monitoring your website now →
14-day free trial. No credit card required.
Free plan available. No credit card needed.
FAQ
What is response time and why does it matter for my website?v
How does Watchman Tower monitor response time?v
What causes high response time?v
What features does Watchman Tower offer for response time monitoring?v
How can I start monitoring my website's response time with Watchman Tower?v
Blog Posts

Average Response Time vs Percentile Metrics: Why Averages Hide API Performance Problems...
Average response time can hide user pain. This guide explains why percentile metrics are critical when teams want latency visibility that reflects real experience.
Learn more about Average Response Time vs Percentile Metrics: Why Averages Hide API Performance Problems
API Response Delay Threshold: Why Fast Responses Matter as Much as Uptime...
An API can return 200 OK and still feel broken to users. This guide explains why response delay belongs inside a broader health view, not just uptime reporting.
Learn more about API Response Delay Threshold: Why Fast Responses Matter as Much as Uptime