Status Page
- Published On: April 1, 2026
- Read Time: 5 min
Status pages help teams turn monitoring into communication. Watchman Tower makes it easier to share uptime, incidents, and recovery progress with the people who need clear answers.
Communicate service health with more clarity, more confidence, and less manual work. Watchman Tower's Status Pages let you publish real-time uptime, incidents, and service health updates on a public page that looks polished and stays current automatically.

Why a Status Page Matters
When users notice downtime or instability, they want answers fast. A public status page gives them a single source of truth instead of forcing them to guess, contact support, or refresh your app repeatedly. It reduces support noise, improves trust, and gives your team a consistent place to communicate during incidents.
If you want the broader strategic context, see What Is a Public Status Page? and Why Every SaaS Needs a Status Page.
What You Can Show
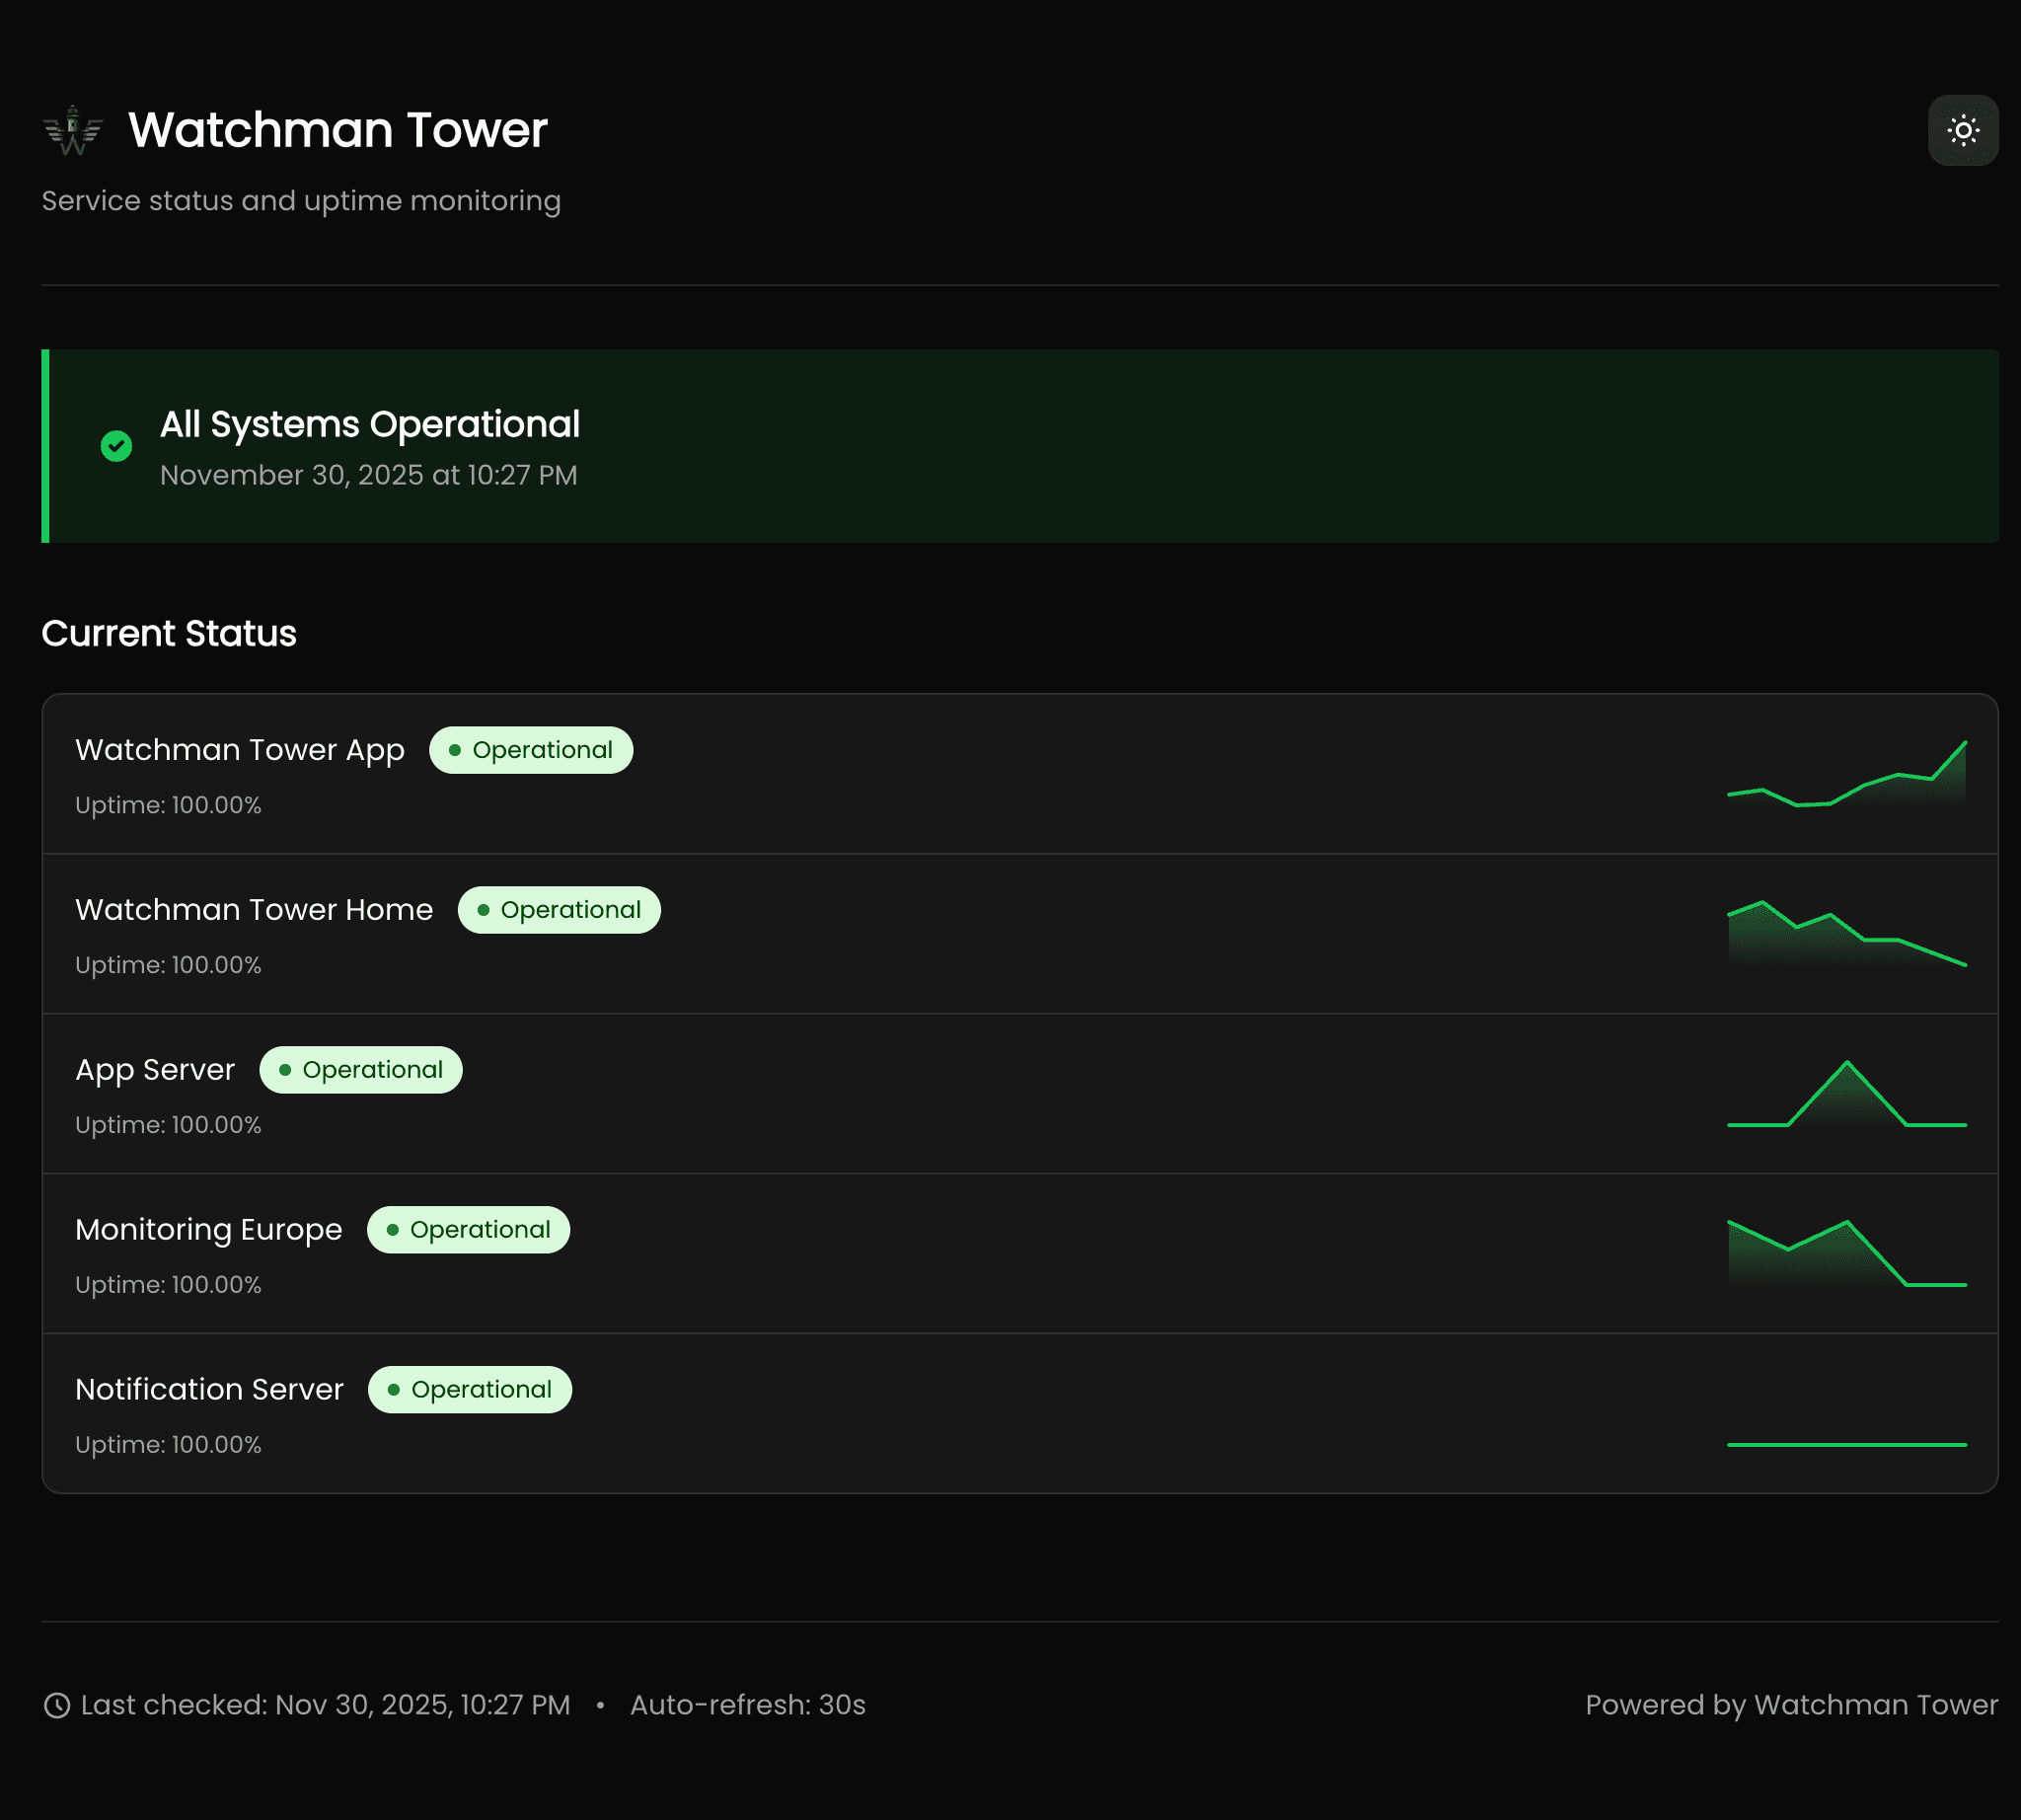
Watchman Tower status pages are designed to help you present the signals users actually care about:
- Real-time service status for websites, APIs, and servers
- Grouped monitored items so public-facing sites and infrastructure services can be presented clearly
- Incident history for recent outages and recovery updates
- Uptime percentages and historical confidence signals
- Performance visibility such as response-time trends where enabled
This makes the page useful both for customers who want a quick answer and for technical teams who need a clearer picture of ongoing health.
Built for Clear Communication
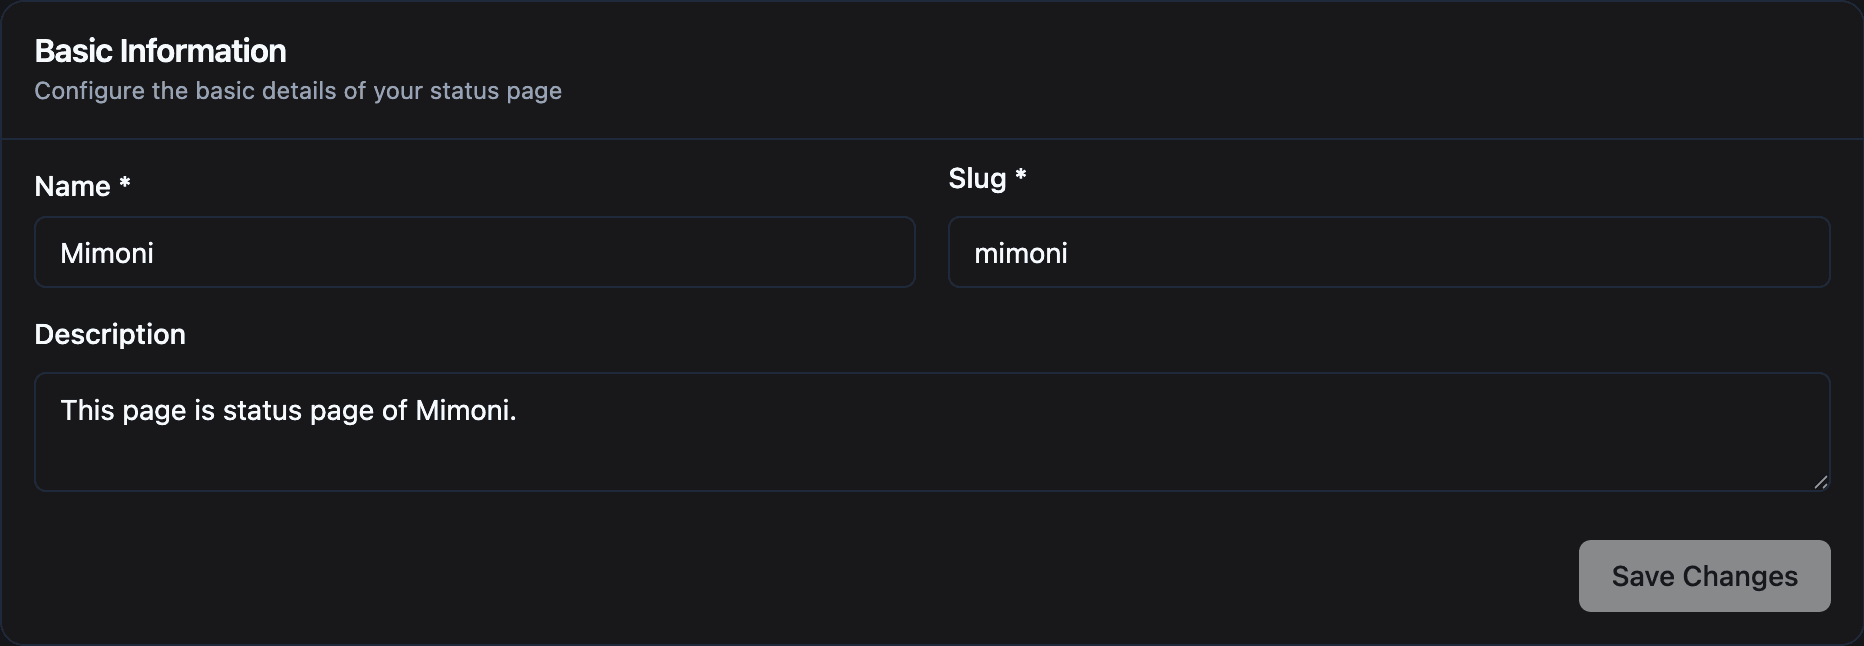
Creating a status page takes only a few steps. Choose the monitors you want to expose, decide which services should be visible, arrange their order, and publish. Once live, the page updates automatically when monitor state changes are detected. That means less manual incident communication and fewer gaps between what your systems know and what your users see.
Need inspiration on structure and tone? Explore our status page examples to see what strong public status communication looks like in practice.

Designed to Look Branded, Not Generic
A status page should not feel like an afterthought. Watchman Tower supports logo-based branding, theme presets, and a cleaner public presentation so your status page feels like part of your product experience rather than a separate tool. This is especially important during incidents, when professionalism and trust are under the most pressure.
Status pages are available across plans, while advanced branding and publishing controls are available on higher tiers. That gives teams a clear path from basic visibility to a more fully branded communication surface.
Custom Domains and Analytics
For teams that want a more branded public presence, Watchman Tower supports custom domains so your page can live at a URL like status.yourdomain.com. Google Tag Manager support is also available for teams that want analytics visibility into how users engage with the page during incidents and updates.
Read more in Custom Domains and Google Tag Manager Integration for Your Status Page.
Who It’s For
- SaaS teams who need a trustworthy incident communication layer
- Agencies and freelancers who want to demonstrate reliability to clients
- DevOps and infrastructure teams who need a clean public-facing health page
- Solo builders who want better transparency without extra operational overhead
What Makes It Different
The goal is not just to say whether something is up or down. It is to present service health in a way that feels calm, structured, and credible. With incident history, grouped services, performance context, and a more polished branded surface, Watchman Tower status pages help teams communicate reliability instead of just reporting outages.
Get Started
Your first status page can be live in minutes. Select the services you want to display, configure the page, and publish a clear source of truth your users can rely on. When incidents happen, you will already have the communication layer in place.
Check your website's health in seconds
Uptime · Response time · SSL · WordPress detection
Free plan available. No credit card needed.

