How We Monitor APIs: A Real-World Example Using Node.js
- Watchman Tower Team
- Updated: July 19, 2026
- Category: API Monitoring
- Read Time: 2 min
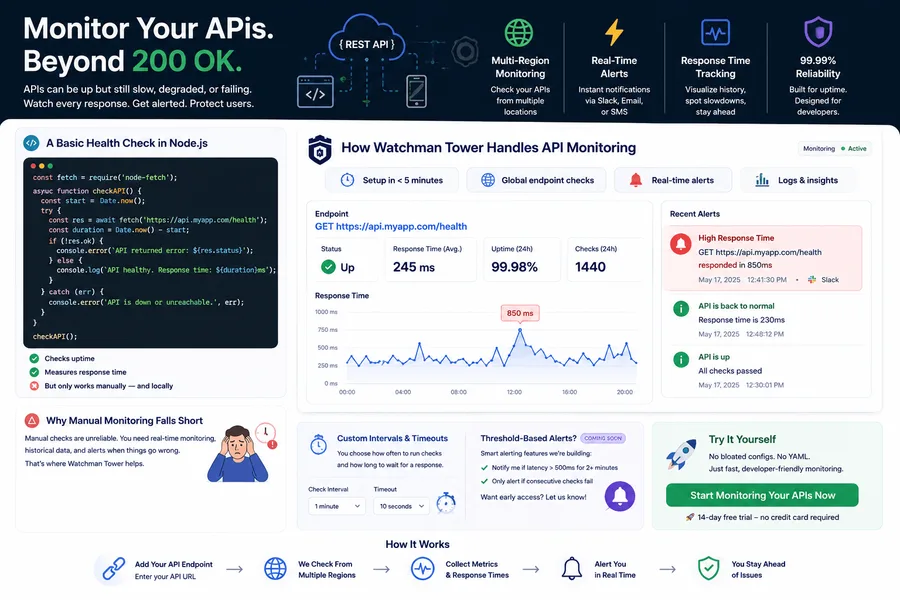
This practical Node.js guide shows how API monitoring starts with basic checks, but becomes more useful when teams connect availability, latency, and failure visibility into one workflow.
APIs are the backbone of modern applications. But just because your API returns a 200 OK doesn't mean everything's working fine.
Slow responses, partial timeouts, or degraded performance can silently break your user experience. In this post, we'll show you:
- How to monitor an API using a simple Node.js example
- Which metrics matter most
- How Watchman Tower handles API monitoring effortlessly
A Basic Health Check in Node.js
const fetch = require('node-fetch');
async function checkAPI() {
const start = Date.now();
try {
	const res = await fetch('https://api.myapp.com/health');
    const duration = Date.now() - start;
    if (!res.ok) {
        console.error(`API returned error: ${res.status}`);
    } else {
        console.log(`API healthy. Response time: ${duration}ms`);
     }
} catch (err) {
     console.error('API is down or unreachable.', err);
}

checkAPI();
✅ Checks uptime
✅ Measures response time
❌ But only works manually — and locally
Why Manual Monitoring Falls Short
Manual checks are unreliable. You need real-time monitoring, historical data, and alerts when things go wrong. That’s where Watchman Tower helps.
How Watchman Tower Handles API Monitoring
- Setup takes less than 5 minutes
- Endpoints are checked from multiple regions
- Slack, Email, and SMS alerts in real-time
- All response times are logged and visualized
Example:
🔔 GET https://api.myapp.com/health responded in 850ms → Slack alert sent
Custom Intervals & Timeouts
You can define how often to run checks and set custom timeout durations. Whether you want to ping your API every 1 minute or every 5 — it’s your choice.
Timeout settings are fully customizable, allowing you to decide when an API should be marked as “down.”
Threshold-Based Alerts? Coming Soon.
We’re working on smart alerting features like:
- “Notify me if latency > 500ms for 2+ minutes”
- “Only alert if consecutive checks fail”
If you'd like early access, let us know. We're building it with developer feedback.
Try It Yourself
No bloated configs. No YAML. Just fast, developer-friendly monitoring.
Start Monitoring Your APIs Now
🚀 14-day free trial – no credit card required
Free plan available. No credit card needed.
FAQ
Why isn't a 200 OK response enough to confirm my API is working properly?v
What does the basic Node.js health check example do?v
Why is manual API monitoring insufficient?v
How does Watchman Tower handle API monitoring?v
Can I customize API check intervals and timeouts in Watchman Tower?v
What advanced alerting features are coming to Watchman Tower?v
Blog Posts

API Functional Checks: Why 200 OK Doesn't Always Mean Your API Works...
Functional checks matter because availability alone does not prove health. This guide explains how teams catch silent API failures that status codes miss.
Learn more about API Functional Checks: Why 200 OK Doesn't Always Mean Your API Works