

Response Time Monitoring
Response time monitoring guides for latency and real performance
Response time monitoring reveals whether a service is merely online or actually usable. This hub covers latency, response time checks, API delay thresholds, averages versus percentiles, and performance signals that help teams catch slowdowns early.
Use these guides to move beyond uptime and understand real user-facing speed.
Response Time Monitoring
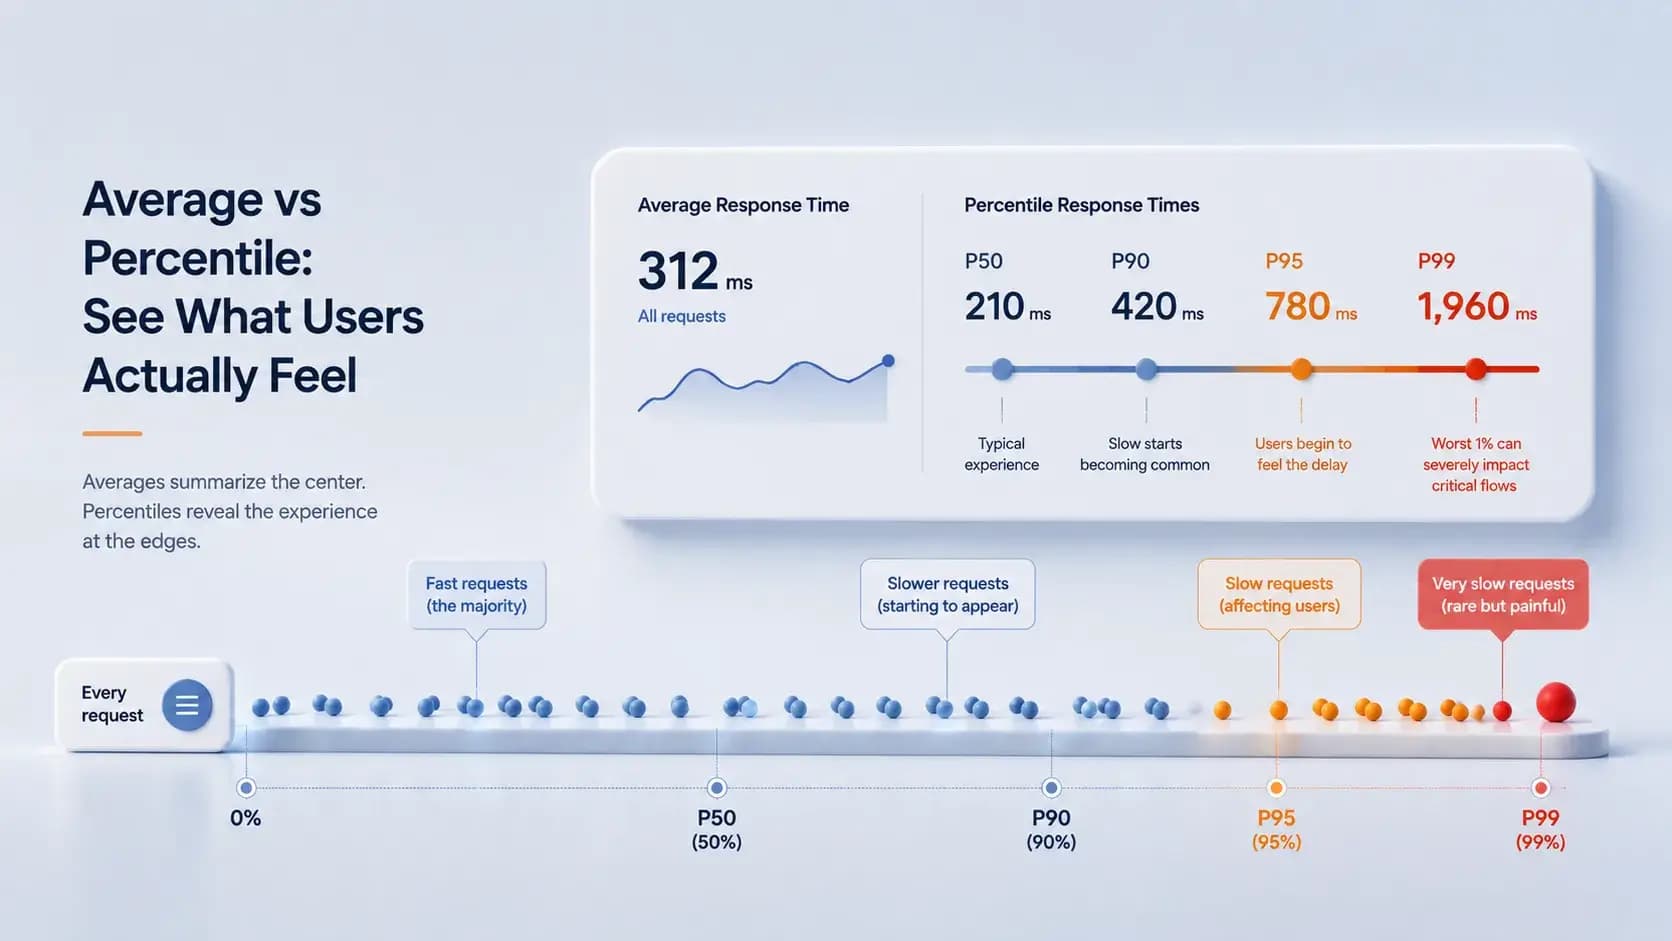
Read More →Average Response Time vs Percentile Metrics: Why Averages Hide API Performance Problems
Average response time can hide user pain. This guide explains why percentile metrics are critical when teams want latency visibility that reflects real experience.
Response Time Monitoring
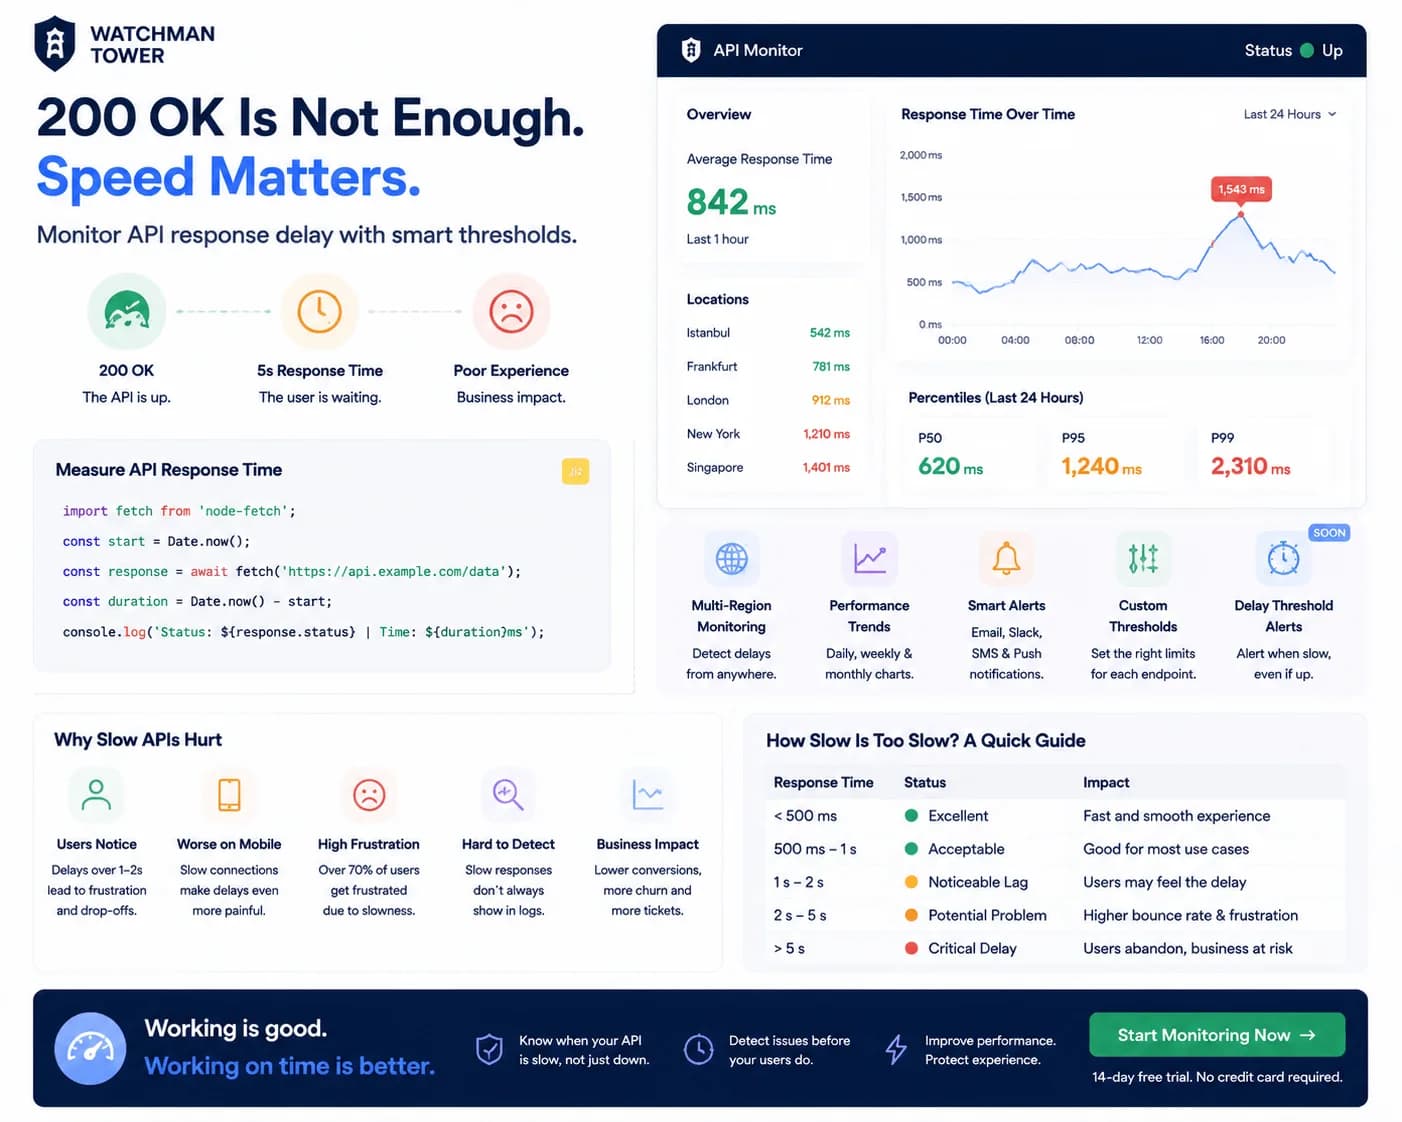
Read More →API Response Delay Threshold: Why Fast Responses Matter as Much as Uptime
An API can return 200 OK and still feel broken to users. This guide explains why response delay belongs inside a broader health view, not just uptime reporting.