How to Use Metrics to Optimize Your Site’s Health
- Published On: April 1, 2026
- Category: Product Insights
- Read Time: 4 min
Metrics help teams optimize site health when they are tied to action, not just dashboards. This guide explains how to use monitoring metrics for better performance decisions.
Why Metrics Matter More Than You Think
Your website might be up — but is it fast? Is it consistent across all users and locations? Uptime tells you if your site is available. Metrics tell you if it's usable.
Key indicators like response time, latency, and availability per region go beyond simple up/down checks. They reveal slow-loading pages, API bottlenecks, or issues only affecting part of your user base.
Curious how all this works? Check out our primer on What Is Website Monitoring.
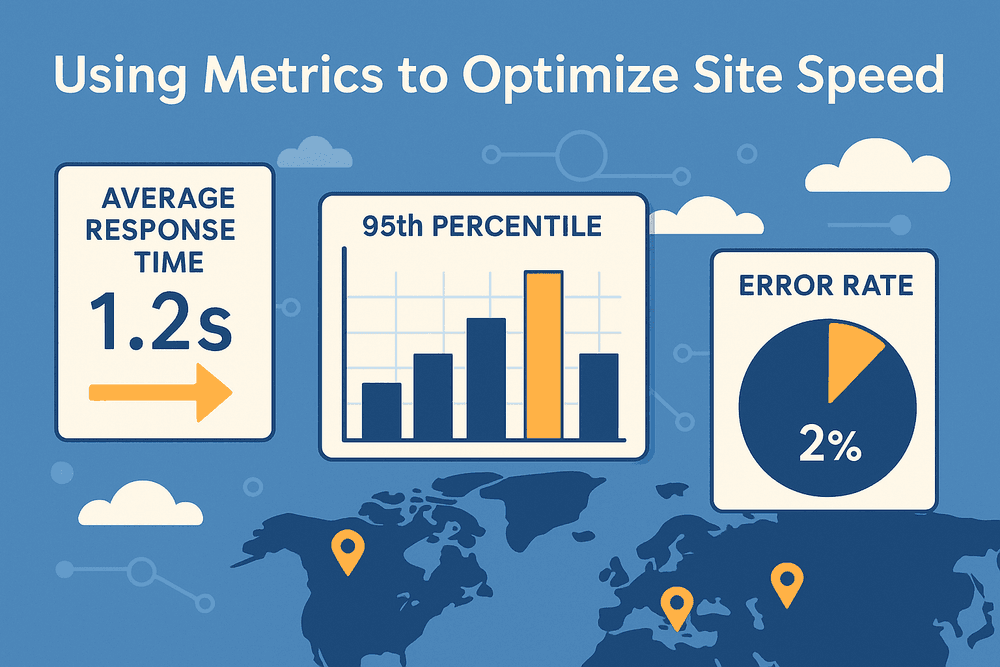
From Data to Decisions: What to Measure
Not all metrics are created equal. These are the ones that matter most:
- Average Response Time – overall server reaction speed
- 95th Percentile Response – captures slowest sessions that affect real users
- Error Rate – API and status code anomalies
- Region-Based Latency – speed from different parts of the world
We break these down in more detail in Essential Website Monitoring Metrics.
Real-World Use Case: Spotting Slowness Before It Spreads
Let’s say your site loads in 400ms on average — but in Europe, it spikes to 2 seconds. Unless you’re watching regional metrics, you’d never know. Meanwhile, conversions tank quietly in that market.
Watchman Tower allows you to see latency by region, over time, and get alerted when things cross critical thresholds.
Metrics in Action: Optimize, Don’t Just Observe
Here’s how to make metrics actionable:
- Track real-time spikes in response time
- Correlate them with deploys or external events
- Set custom thresholds to get notified before users notice
This is where smart monitoring goes beyond dashboards. Learn more in Average vs Percentile Response Times.
Next Step: Build a Metric-Driven Workflow
Performance isn’t just a dev concern — it’s a business concern. When you start measuring what matters, you can:
- Justify performance fixes to stakeholders
- Plan scaling strategies based on actual load
- Predict issues before users are affected
Getting started is easy — just add your site to the Watchman Tower dashboard and start seeing metrics instantly. No setup or install required.
Ready to Speed Up?
Your users expect fast. Metrics show you how close you are — and what’s in the way. With Watchman Tower, you don't just watch performance. You improve it.
Check your website's health in seconds
Uptime · Response time · SSL · WordPress detection
Free plan available. No credit card needed.