From Datadog Fatigue to Focused Monitoring: A Journey to Simplicity
- Published On: April 1, 2026
- Category: Product Insights
- Read Time: 5 min
This comparison looks at website monitoring tools through a broader operational lens, not just raw uptime checks.
The Breaking Point
One Tuesday morning, our dashboard showed green across the board. 99.9% uptime. Response times within range. Zero critical alerts. Everything looked perfect.
Then Slack exploded. Users couldn't complete checkouts. Pages were timing out. Support tickets piled up faster than we could read them.
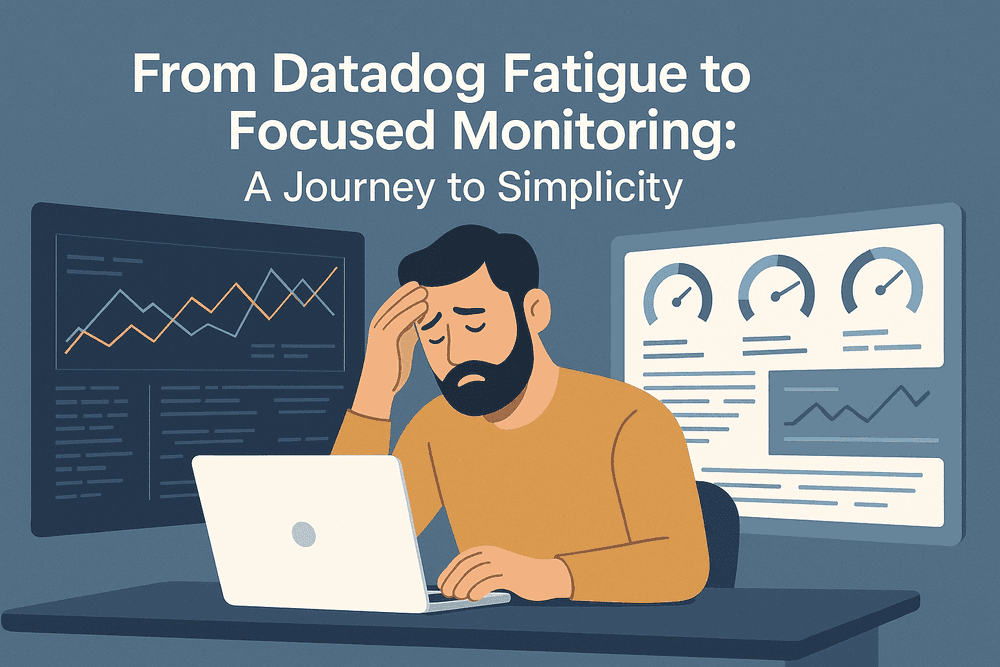
We had 47 Datadog dashboards. Hundreds of metrics. Thousands of data points. Yet we completely missed what actually broke.
That's when it hit us: we weren't observing our system — we were just watching numbers scroll by.
What Went Wrong
The problem wasn't Datadog itself. It was how we used it.
We fell into the classic trap: if we monitor everything, we'll catch everything. So we added more metrics. More dashboards. More alerts. We configured Slack notifications for anomalies, spikes, drops, and trends.
The result? Alert fatigue became our new normal.
Every day brought 20-30 notifications. Most were noise: a temporary CPU spike, a cache miss, a slow query that resolved itself. We started ignoring them. And when something truly critical happened, it got lost in the noise.
We spent more time managing our monitoring than actually building product.
The Moment of Clarity
After that Tuesday incident, we did a post-mortem. Not of the outage — of our observability stack.
We asked ourselves: What do we actually need to know?
The answer was surprisingly simple:
- Is the site up? (Can users reach us?)
- Is it fast? (Are pages loading quickly?)
- Are users succeeding? (Can they complete their goals?)
Everything else was context, not core. We didn't need to know if CPU hit 73% at 3am if users weren't affected. We didn't need real-time memory graphs if the site was responding fine.
We needed peace of mind, not a data science degree.
Building Watchman Tower
That's when we created Watchman Tower — not as "Datadog for small teams," but as the opposite of Datadog.
Instead of collecting everything, we focused on what matters:
One dashboard. Three metrics. Zero noise.
- Uptime monitoring that actually checks if your site works (not just if the server responds)
- Response time tracking from real user locations
- Success rate monitoring for critical user flows
We killed the features nobody asked for:
- ❌ No custom metrics (you don't need them)
- ❌ No complex queries (if you need to write code to see your data, something's wrong)
- ❌ No alert fatigue (we only notify when users are actually impacted)
The result? We went from checking dashboards every 30 minutes to checking once a day. From 20 alerts per day to 2 per month. From constant anxiety to actual confidence.
What Changed
Within the first week of using Watchman Tower:
- Alert fatigue dropped by 85% — we only got notified when something truly mattered
- MTTR improved by 60% — when we did get alerted, we knew exactly what was wrong
- Team focus returned — we stopped being monitoring administrators and went back to building
But the biggest change wasn't measurable. It was psychological.
We stopped feeling like we needed to constantly watch our infrastructure. The paranoia disappeared. We trusted our monitoring to tell us if something was wrong, so we could focus on what was right.
One engineer put it perfectly: "I forgot what it felt like to not be anxious about production."
For Teams Like Yours
Watchman Tower works best for:
- Indie hackers shipping solo or with 1-2 co-founders
- Bootstrap SaaS teams (5-15 people) who can't afford a dedicated DevOps engineer
- Product-focused startups where engineering time is precious
- Anyone tired of enterprise monitoring built for enterprise problems
If you're spending more time configuring monitoring than building features, you're our people.
If you've ever muted a Slack channel because the alerts were too noisy, you're our people.
If you just want to know "is my site okay?" without a PhD in observability, you're definitely our people.
The Philosophy
We believe monitoring should be like a good smoke detector:
- Silent when things are fine
- Loud when things are wrong
- Simple enough that anyone can understand it
Datadog is a spaceship control panel. Watchman Tower is a dashboard light. Both are monitoring, but only one makes sense when you're driving alone.
A Real Story
Last month, we launched Watchman Tower publicly. Within the first week, a solo developer signed up and configured monitoring for his e-commerce site in under 3 minutes.
Two days later, he got his first alert at 2am. His payment gateway was timing out. He switched to his backup processor, fixed the issue, and went back to sleep.
The next morning, he sent us a message: "I've been running this site for 2 years. This is the first time I caught a problem before losing sales."
That's exactly why we built this.
Try It Yourself
Watchman Tower is free for your first site. No credit card. No trial countdown. Just simple monitoring that works.
Set up takes 2 minutes. You'll get:
- Uptime monitoring that checks your site every minute
- Real user response time tracking
- Instant Slack/email alerts (only when it matters)
- A dashboard you can actually understand
Stop drowning in data. Start watching what matters.
Start Monitoring in 2 Minutes →
P.S. — Looking for the right monitoring plan for your team? Check out our pricing options — all plans include unlimited team members and alerts.
Check your website's health in seconds
Uptime · Response time · SSL · WordPress detection
Free plan available. No credit card needed.
FAQ
Blog Posts

Beyond Uptime: How to Detect Slowdowns Before They Become Incidents...
Uptime alone does not show the whole problem. This guide explores how teams detect slowdowns, degradations, and early incident signals before systems are fully down.
Learn more about Beyond Uptime: How to Detect Slowdowns Before They Become Incidents
Why Average Response Time Can Be Misleading: A Case for Percentile Metrics...
Average response time can hide user pain. This guide explains why percentile metrics are critical when teams want latency visibility that reflects real experience.
Learn more about Why Average Response Time Can Be Misleading: A Case for Percentile Metrics
How We Monitor APIs: A Real-World Example Using Node.js...
This practical Node.js guide shows how API monitoring starts with basic checks, but becomes more useful when teams connect availability, latency, and failure visibility into one workflow.
Learn more about How We Monitor APIs: A Real-World Example Using Node.js