

How to Use Watchman Tower: A Step-by-Step Guide to Website Monitoring
- Watchman Tower Team
- Updated: July 24, 2026
- Category: Product Insights
- Read Time: 2 min
This guide shows how to use Watchman Tower for website monitoring while keeping uptime, alerts, and response behavior inside a broader digital health workflow.
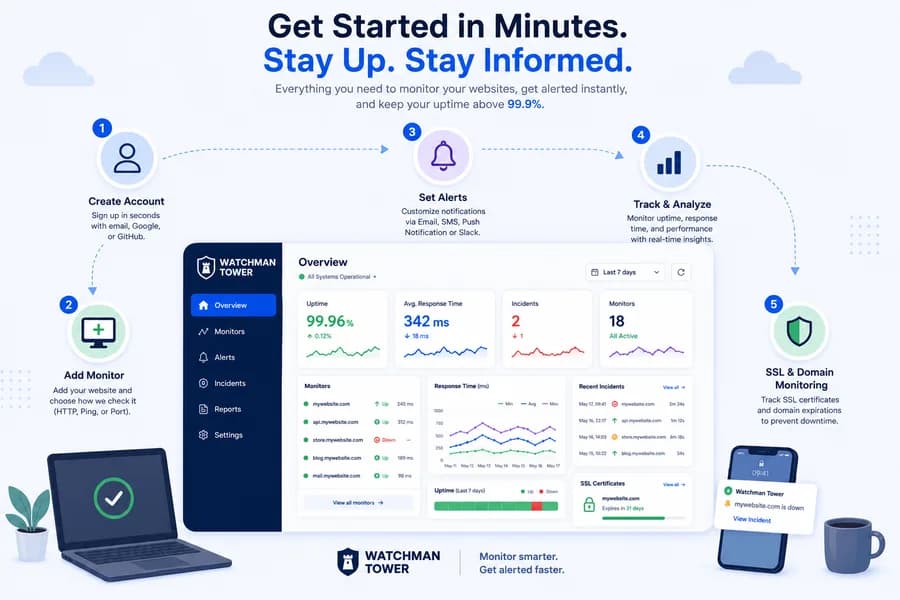
Getting started with Watchman Tower is fast and simple — even if you're not a developer. This guide walks you through the key steps to monitor your websites in just a few minutes, get notified instantly, and keep your uptime above 99.9%.
1. Create Your Free Account
Visit our homepage and click on “Start Free Monitoring”. Sign up using your email, Google, or GitHub account.

2. Add Your First Monitor
Go to Monitors and click on “New Monitoring”. Enter your site’s URL, choose a method (HTTP, Ping, or Port), and configure how often Watchman Tower should check it.
You can also define:
- Timeout threshold: how long we wait for a response
- Check interval: how often checks run (e.g. every 1, 5, or 10 minutes)

3. Customize Notifications
Choose how and when you get alerted. Click your added monitor configure Email, SMS, or Slack alerts.
You can define smart rules to avoid noise, such as:
- Only alert if downtime lasts more than X minutes
- Notify only during work hours
- Repeat notifications if still down

4. Real-Time Metrics & Visualizations
Once your monitor is active, you'll see:
- Uptime percentage over days or weeks
- Response time metrics (min, max, avg)
- Downtime graphs & visual breakdown
Want to understand the charts better? Check this guide.

5. Incident Logs & Event History
Watchman Tower logs every monitoring event: up, down, timeout, or slow response. Each monitor has its own event stream, including:
- Exact timestamps
- Error type or HTTP status
- Recovery time
6. SSL & Domain Expiry Tracking
Prevent downtime due to certificate or domain expiration. Watchman Tower monitors:
- SSL validity and expiration date
- Domain registrar expiration
SSL Monitoring & Domain Monitoring
Need More Help?
Browse our FAQ section or check out the Watchman Tower Blog for more tutorials and best practices.
Watchman Tower was built to give you full visibility without the complexity. Whether you're a solo founder or a growing team — we’ve got your back.
Free plan available. No credit card needed.
FAQ
How do I sign up for Watchman Tower?v
How do I set up a website monitor?v
Can I customize downtime alerts?v
What performance metrics does Watchman Tower provide?v
How are incidents logged in Watchman Tower?v
Does Watchman Tower monitor SSL and domain expiration?v
Blog Posts
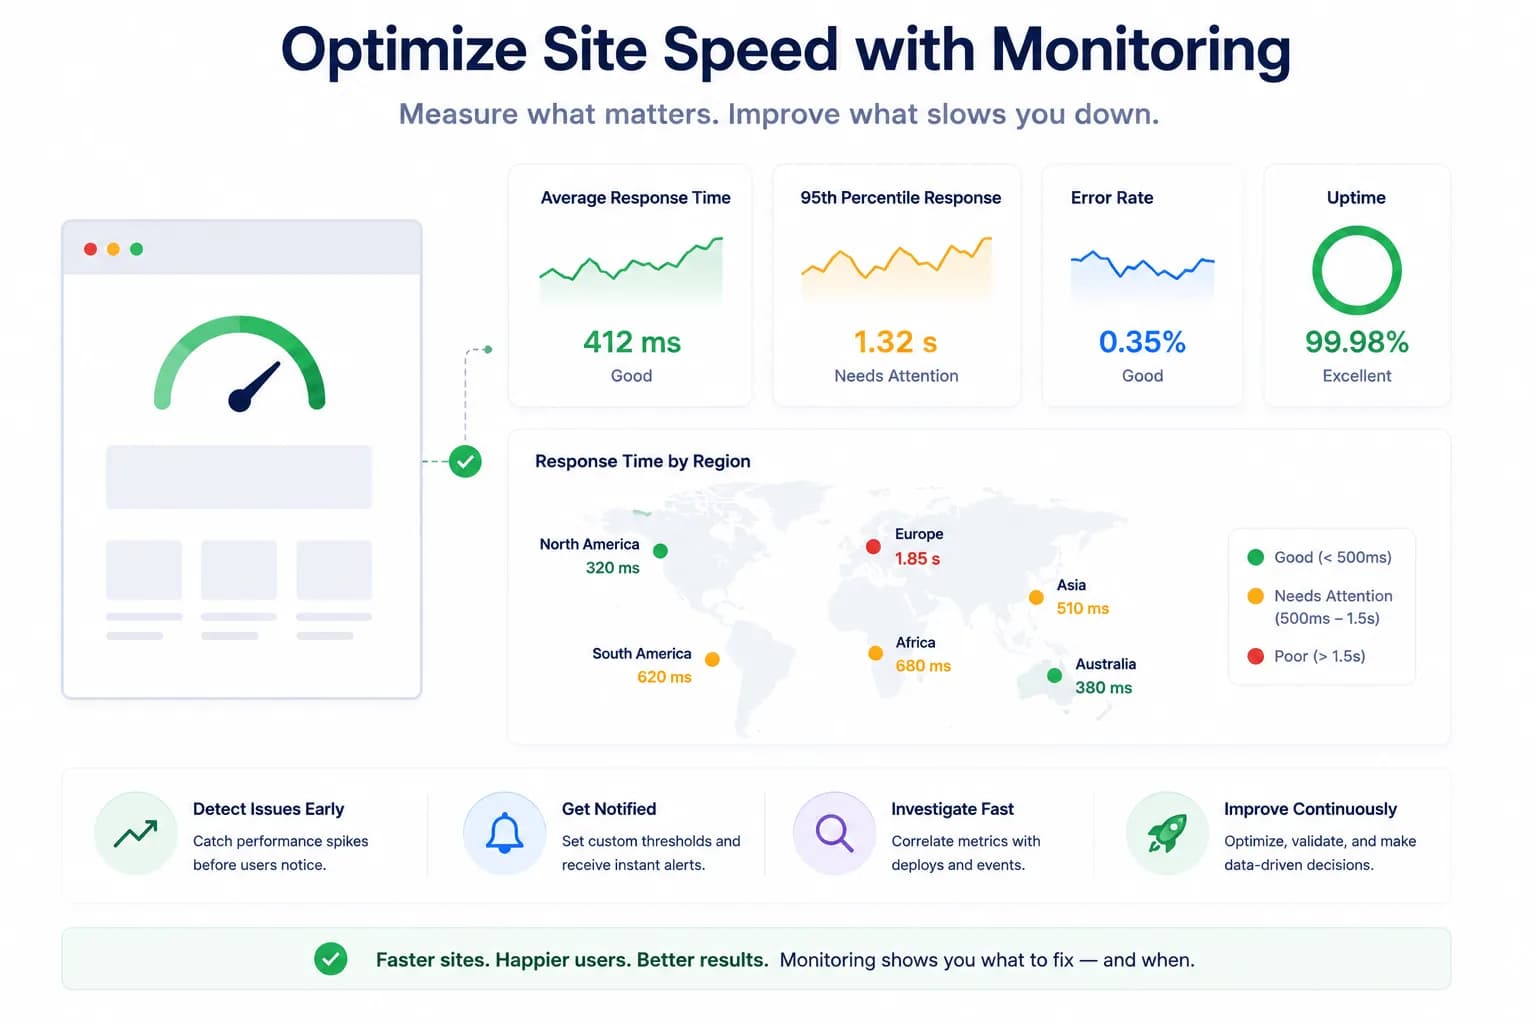
How to Use Metrics to Optimize Your Site’s Health...
Metrics help teams optimize site health when they are tied to action, not just dashboards. This guide explains how to use monitoring metrics for better performance decisions.
Learn more about How to Use Metrics to Optimize Your Site’s Health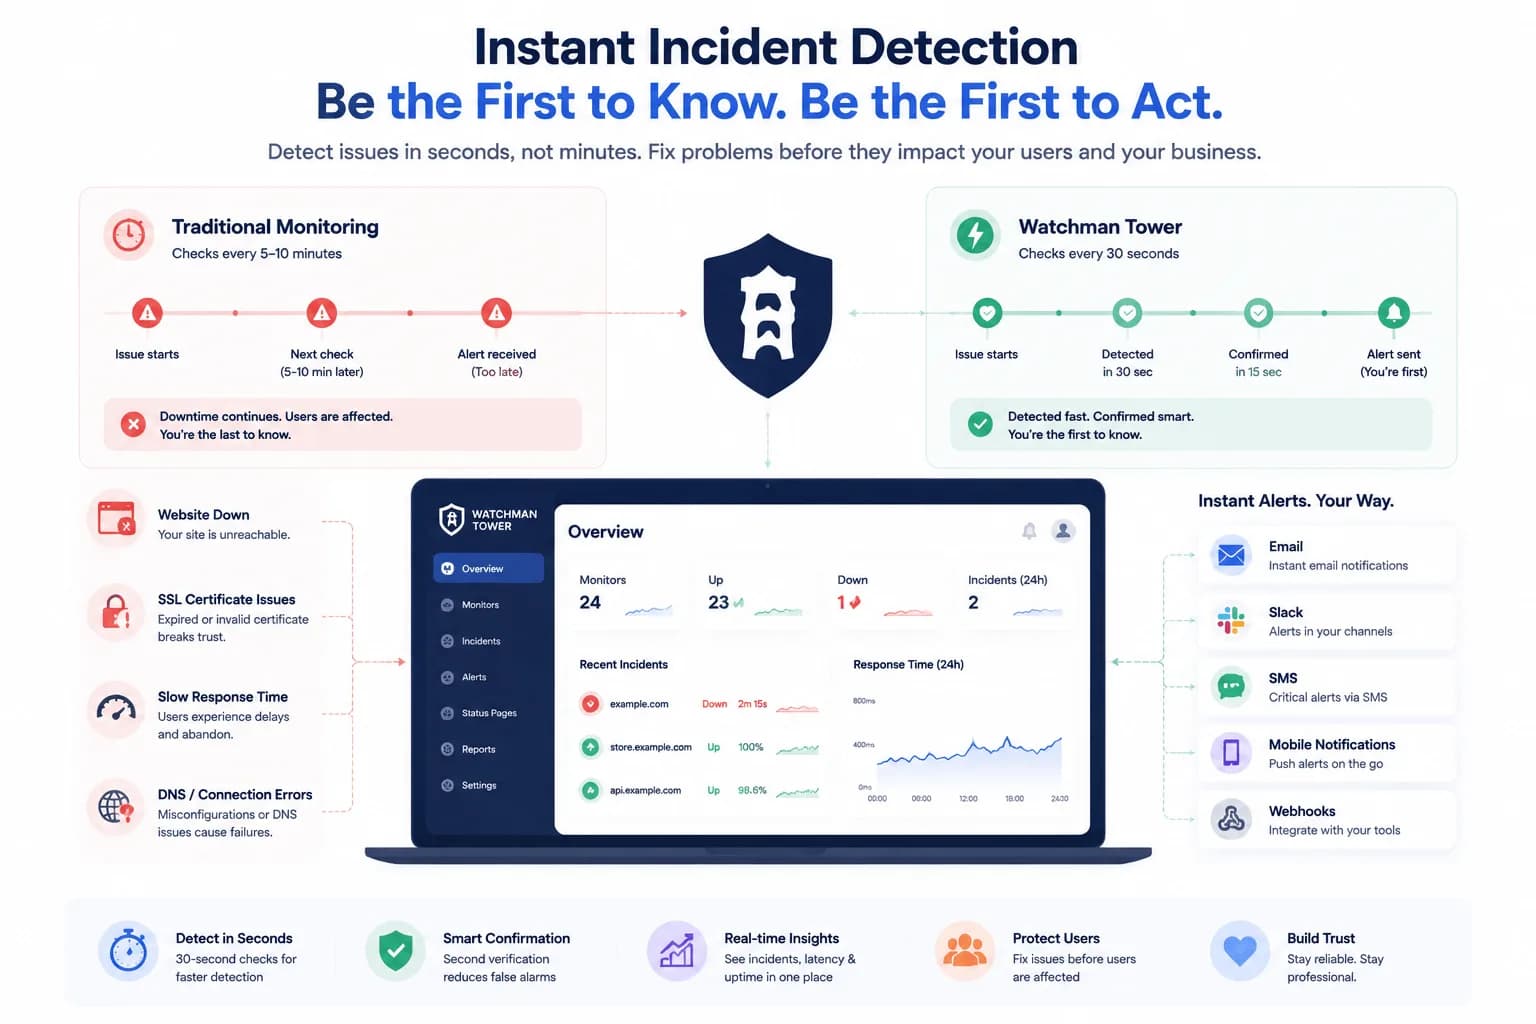
How to Get Notified Instantly When Something Breaks...
Real-time notifications matter most when they arrive with enough context to act. This guide explains how teams build faster response around smarter alerting workflows.
Learn more about How to Get Notified Instantly When Something Breaks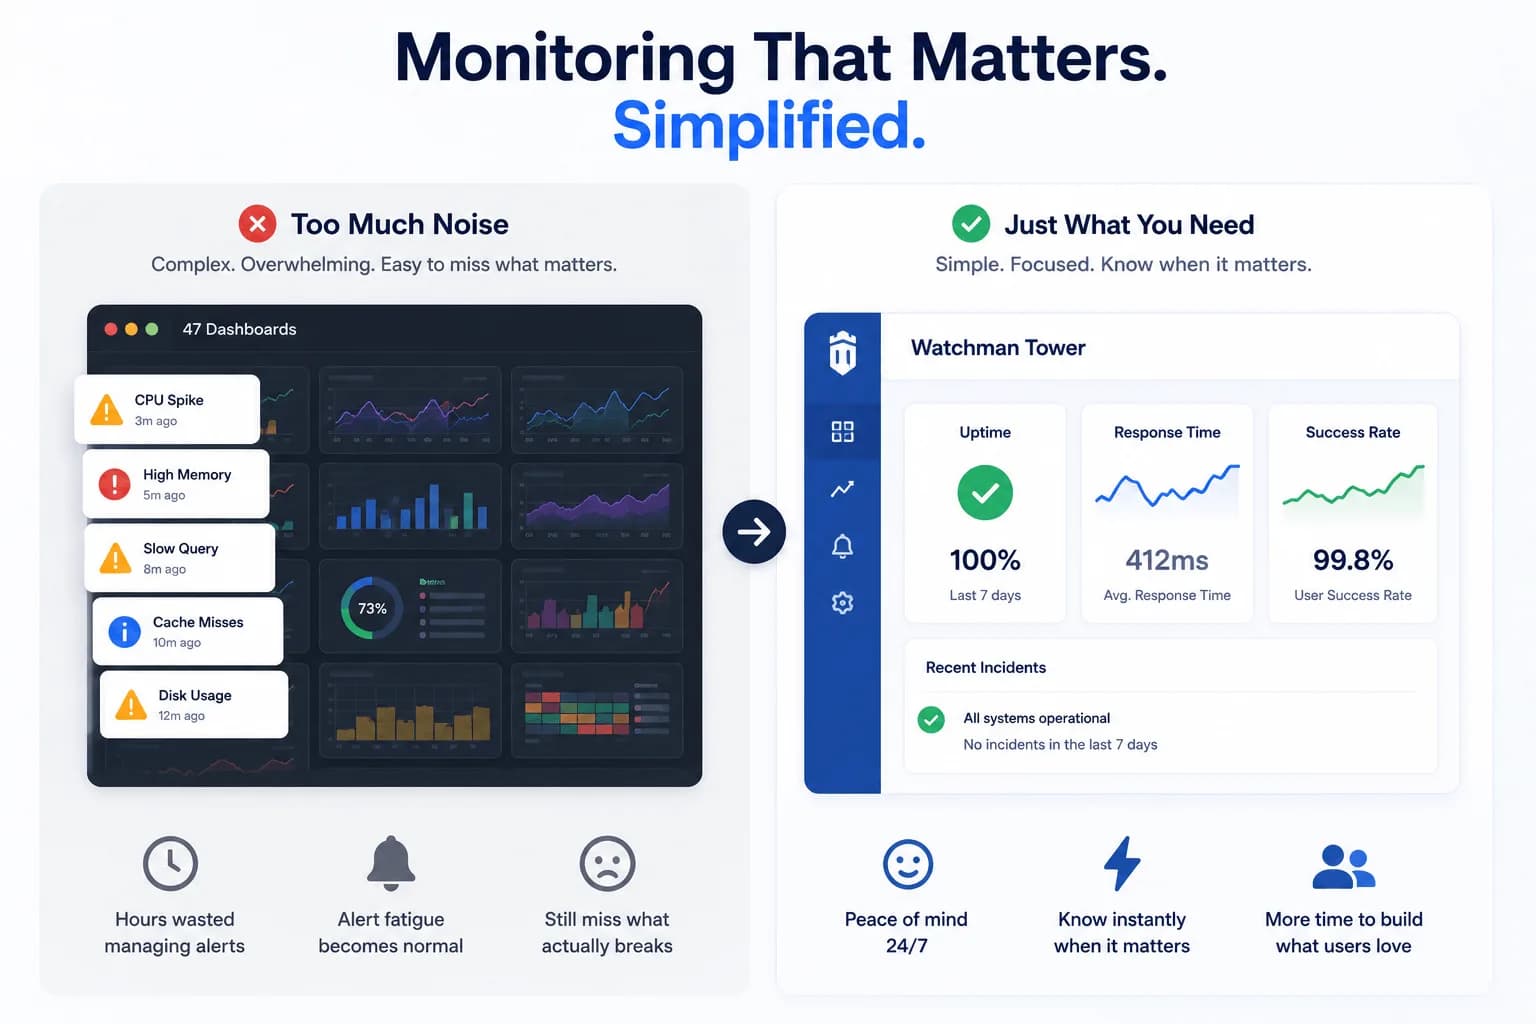
From Datadog Fatigue to Focused Monitoring: A Journey to Simplicity...
This comparison looks at website monitoring tools through a broader operational lens, not just raw uptime checks.
Learn more about From Datadog Fatigue to Focused Monitoring: A Journey to Simplicity