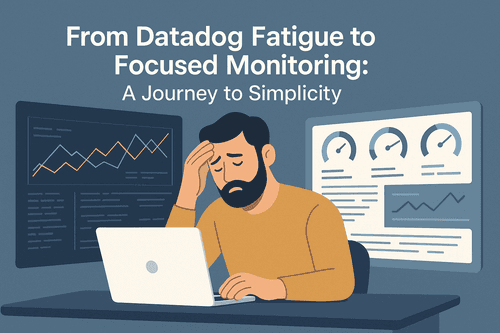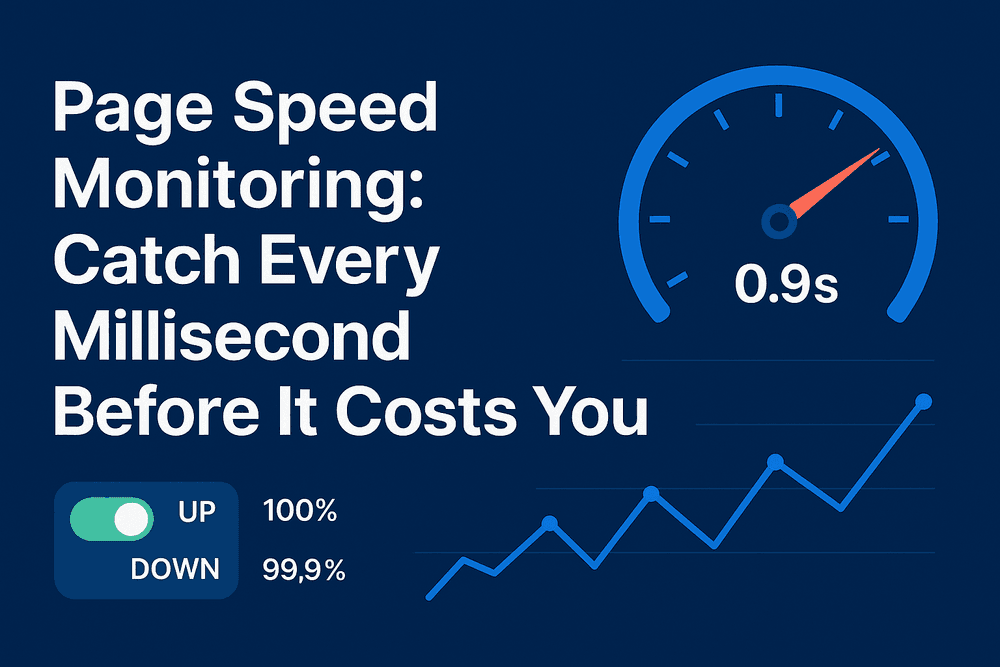
Why Page Speed Matters More Than Ever
Speed isn't just about performance — it's about trust. Your users expect pages to load instantly, and search engines reward fast sites with better visibility. If you're already monitoring uptime with tools like Watchman Tower, you're protecting availability. But what about the quality of that availability?
A site can be "up" but still feel broken if it loads too slowly.
Response time monitoring helps you track how fast your server responds to requests. But performance goes deeper than that. It's about how quickly users can actually interact with your content — and that's where advanced page speed metrics come in.
What You're Actually Measuring
When we talk about page speed, we're not just measuring one thing. Different metrics capture different parts of the user experience:
Response Time (Available Now)
This is your baseline. Response time tells you how fast your server responds to a request. With Watchman Tower, you're already tracking this alongside uptime checks. If response times spike, you know something's wrong — even if the site is technically "up."
Core Web Vitals (Coming Soon)
Google's Core Web Vitals measure the actual user experience:
- TTFB (Time to First Byte): How fast your server responds (overlaps with response time)
- FCP (First Contentful Paint): When users see something meaningful on screen
- LCP (Largest Contentful Paint): When the main content is fully loaded and usable
These timings vary by location, device, and network conditions. A page might load instantly in New York but crawl in Tokyo. That's why monitoring from multiple regions is essential — and it's something we're building into Watchman Tower.
For context on why reliability extends beyond simple up/down checks, see our guide on Uptime Monitoring Metrics.
The Real Cost of Slow Pages
Slowness compounds fast. Here's what happens when pages lag:
- Higher bounce rates: 53% of mobile users leave if a page takes over 3 seconds to load
- Abandoned checkouts: E-commerce conversions drop by 7% for every 100ms delay
- SEO penalties: Google's Core Web Vitals directly impact rankings — slow sites get buried
- Damaged trust: If your site feels sluggish, your brand feels unreliable
If you're already protecting your domain renewals with domain expiration monitoring, apply the same vigilance to page speed. You can't retain users if your pages feel broken — even when they're technically online.
How to Monitor Page Speed Effectively
Great page speed monitoring isn't just about collecting numbers. It's about turning those numbers into action. Here's what effective monitoring looks like:
1. Track Response Times Alongside Uptime
With Watchman Tower, you can already see how fast your server responds to requests. Set alert thresholds so you're notified when response times exceed acceptable limits — not just when the site goes down completely.
2. Monitor Server Resources
Slow pages are often caused by server bottlenecks. Use server monitoring to track CPU, memory, and disk usage. If response times spike while CPU hits 100%, you've found your culprit.
3. Review Trends Over Time
A single slow response might be a fluke. A trend of gradually increasing response times signals a real problem. With reports, you can spot these patterns before they become critical.
4. Test From Multiple Locations (Coming Soon)
Your site might load fast in one region but crawl in another. Soon, Watchman Tower will let you test from multiple locations worldwide — capturing real latency variations that affect your global users.
5. Correlate Slowdowns With Events
Did response times spike after a deployment? After a traffic surge? Correlating performance data with events helps you identify root causes faster.
From Metrics to Action
Numbers are only useful if they lead to fixes. When you spot slow pages, here's what to investigate:
Server-Side Issues
- High CPU or memory usage (check via server monitoring)
- Slow database queries
- Unoptimized backend code
- Insufficient server resources for traffic volume
Frontend Issues
- Heavy JavaScript bundles or unoptimized images
- Third-party scripts blocking rendering
- Unoptimized CSS or web fonts
- Too many HTTP requests
Infrastructure Issues
- CDN misconfigurations or cache misses
- DNS resolution delays
- Network routing problems
The key is catching regressions early. A single bad deployment can slow your site by 30% without triggering a downtime alert. That's why monitoring response times — not just availability — is essential.
Learn more about proactive monitoring strategies in What Is Smart Monitoring?
What's Coming Next
We're expanding Watchman Tower's performance monitoring capabilities. Soon, you'll be able to:
- Track Core Web Vitals: Monitor LCP, FCP, and TTFB to match what Google sees
- Test from multiple regions: Understand how your site performs for users worldwide
- Get performance regression alerts: Be notified when pages slow down gradually, not just when they crash
- See trends in weekly reports: Performance data integrated with your existing uptime, SSL, and domain reports
All in the same clean, clutter-free dashboard you already know. No setup complexity. Just actionable insights.
The Takeaway
Page speed is the heartbeat of your digital experience. If it slows, everything else follows — conversions, rankings, trust.
You're already monitoring uptime and response times. That's a solid foundation. Soon, you'll have even deeper visibility into performance with Core Web Vitals and multi-location testing.
But you don't need to wait. Start by setting alert thresholds on your response times, reviewing your weekly reports for trends, and correlating slowdowns with server resource usage. These simple steps catch most performance issues before they impact users.
Ready to level up your monitoring? Start with Watchman Tower — real-time uptime, SSL, domain, and server monitoring with instant alerts. Because downtime (and slowness) should never catch you off guard.