How to Monitor Nginx Health and Detect Serving Issues Early
- Published On: July 17, 2026
- Category: Server Monitoring
- Read Time: 3 min
Nginx problems do not always begin with a full outage. Good monitoring helps teams detect service failures, port issues, and serving risk before traffic breaks completely.
Why Nginx Health Matters
Nginx often sits directly in the request path for production traffic. It may terminate TLS, proxy requests, serve static assets, or route traffic to upstream applications. When it becomes unhealthy, the impact is immediate even if the rest of the server looks stable.
That is why Nginx health deserves its own monitoring lens instead of being treated as a side detail in host metrics. For the broader model, see What Is Server Monitoring?.
Why CPU and Memory Alone Are Not Enough
A server can show normal CPU, memory, and disk usage while Nginx is stopped, degraded, or misconfigured. If monitoring only watches host charts, teams may not realize the actual serving layer is the thing that failed.
Nginx issues are often operational rather than resource-driven. That makes service-aware monitoring much more useful than host-only visibility.
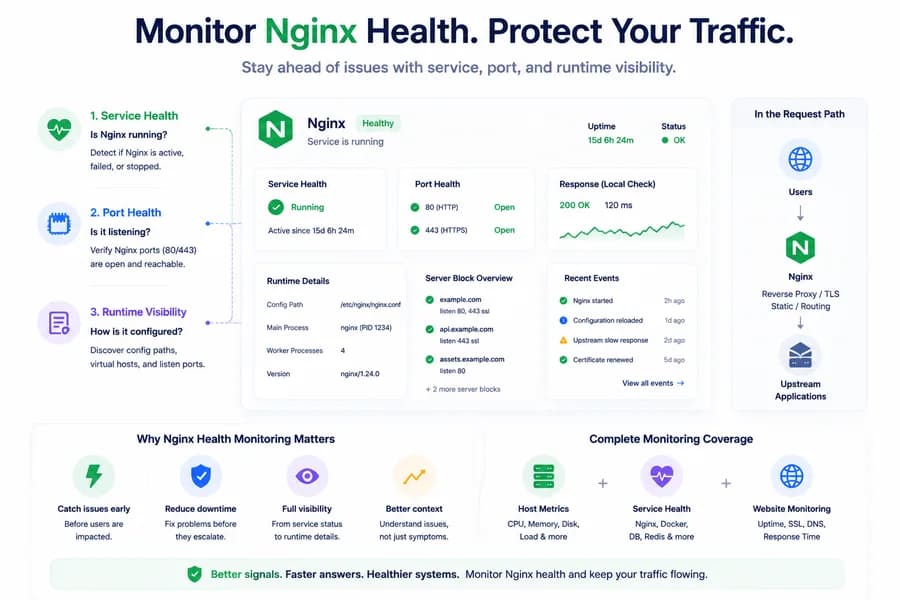
The First Signal: Service Health
The most important starting point is simple: is Nginx actually running?
Service health answers that question directly. If Nginx is inactive, failed, or otherwise unavailable, teams immediately know the request path is at risk even before digging into logs or application behavior.
This signal is especially useful because it turns a generic incident into a clear investigation path.
The Second Signal: Port Health
Port checks add another important layer. Even if a service appears active, the expected local port may not be listening correctly. For web traffic, this usually means the system should verify whether ports like 80 or 443 are actually open and reachable on the host.
Port health does not replace service status, but it helps teams confirm whether Nginx is not just running, but positioned to serve traffic in the expected way. If you want the relationship between these two signals, read Port Monitoring vs Service Monitoring.
The Third Signal: Runtime Visibility
Runtime visibility closes the gap between “Nginx exists” and “Nginx is operationally useful.” This includes things like local serving context, discovered configuration paths, and visibility into the virtual hosts or listen ports tied to Nginx behavior.
These signals help teams understand not just whether Nginx is alive, but how it is participating in the system.
Why Early Detection Matters
Nginx issues do not always start as complete outages. A service restart, a broken config deploy, an unavailable upstream, or an unhealthy request path can show up as partial breakage before everything fails outright.
Good Nginx monitoring helps teams catch those earlier signals so they can investigate before users feel a full incident.
What a Practical Nginx Monitoring Stack Should Include
A practical monitoring approach for Nginx should combine:
- Nginx service health
- local port checks for expected web ports
- host metrics for resource pressure context
- external uptime checks to confirm user-facing reachability
- runtime-aware visibility into how Nginx is configured and serving traffic
Each layer answers a different question, and together they create much better operational clarity.
How This Fits Into Broader Monitoring
Nginx should not be monitored in isolation. It sits between external traffic and the services behind it. That means teams get the best results when Nginx health is interpreted alongside uptime checks, server metrics, service health, and runtime signals from the wider environment.
That is how you move from noticing that traffic is failing to understanding why.
How Watchman Tower Approaches Nginx Visibility
Watchman Tower uses wt-warden to add local Nginx-related visibility through service health, port health, and Nginx discovery signals when configuration is readable. This helps teams understand whether Nginx is available, whether expected ports are listening, and what serving context may exist on the host.
Combined with uptime checks, this creates a stronger picture of both internal and external serving health. You can explore the product view on the Server Monitoring feature page.
Related Reading
To continue, read why service health matters more than host metrics alone and why server monitoring and website monitoring work best together.
Final Thought
If Nginx is part of your production path, monitoring CPU and memory alone is not enough. Nginx health becomes much easier to understand when teams watch service status, expected ports, and runtime-aware context together instead of relying only on host-level charts.
Check your website's health in seconds
Uptime · Response time · SSL · WordPress detection
Free plan available. No credit card needed.
FAQ
Blog Posts
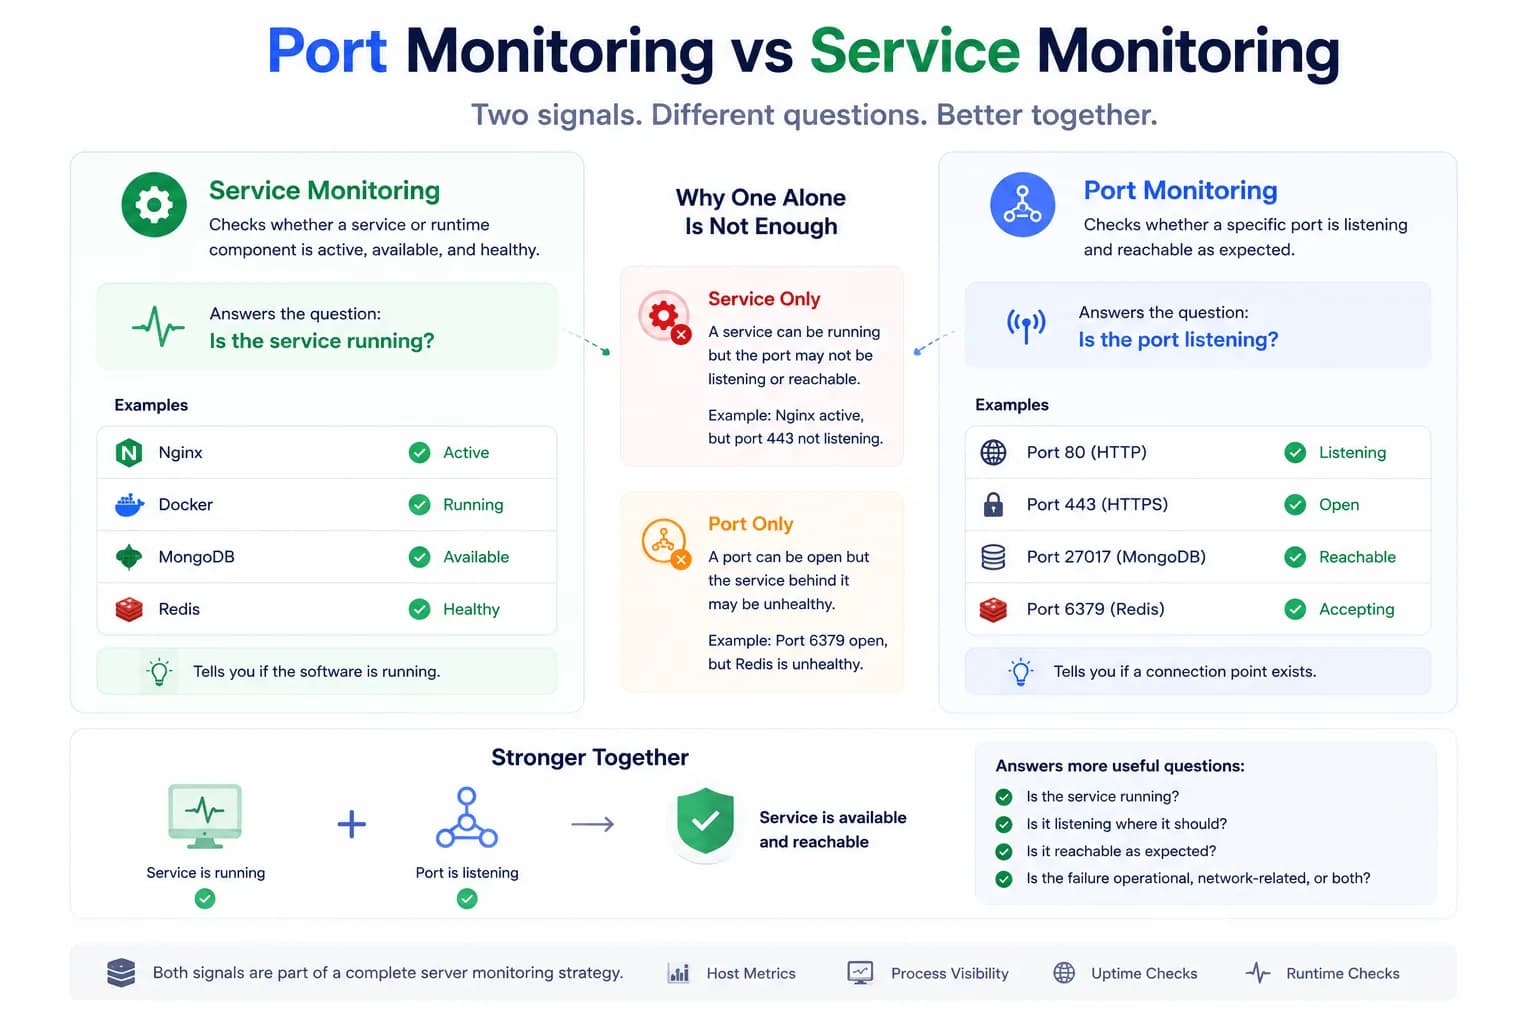
Port Monitoring vs Service Monitoring: What’s the Difference?...
A service can be running while the expected port is not listening correctly. A port can be open while the service behind it is degraded. Good monitoring needs to understand both layers.
Learn more about Port Monitoring vs Service Monitoring: What’s the Difference?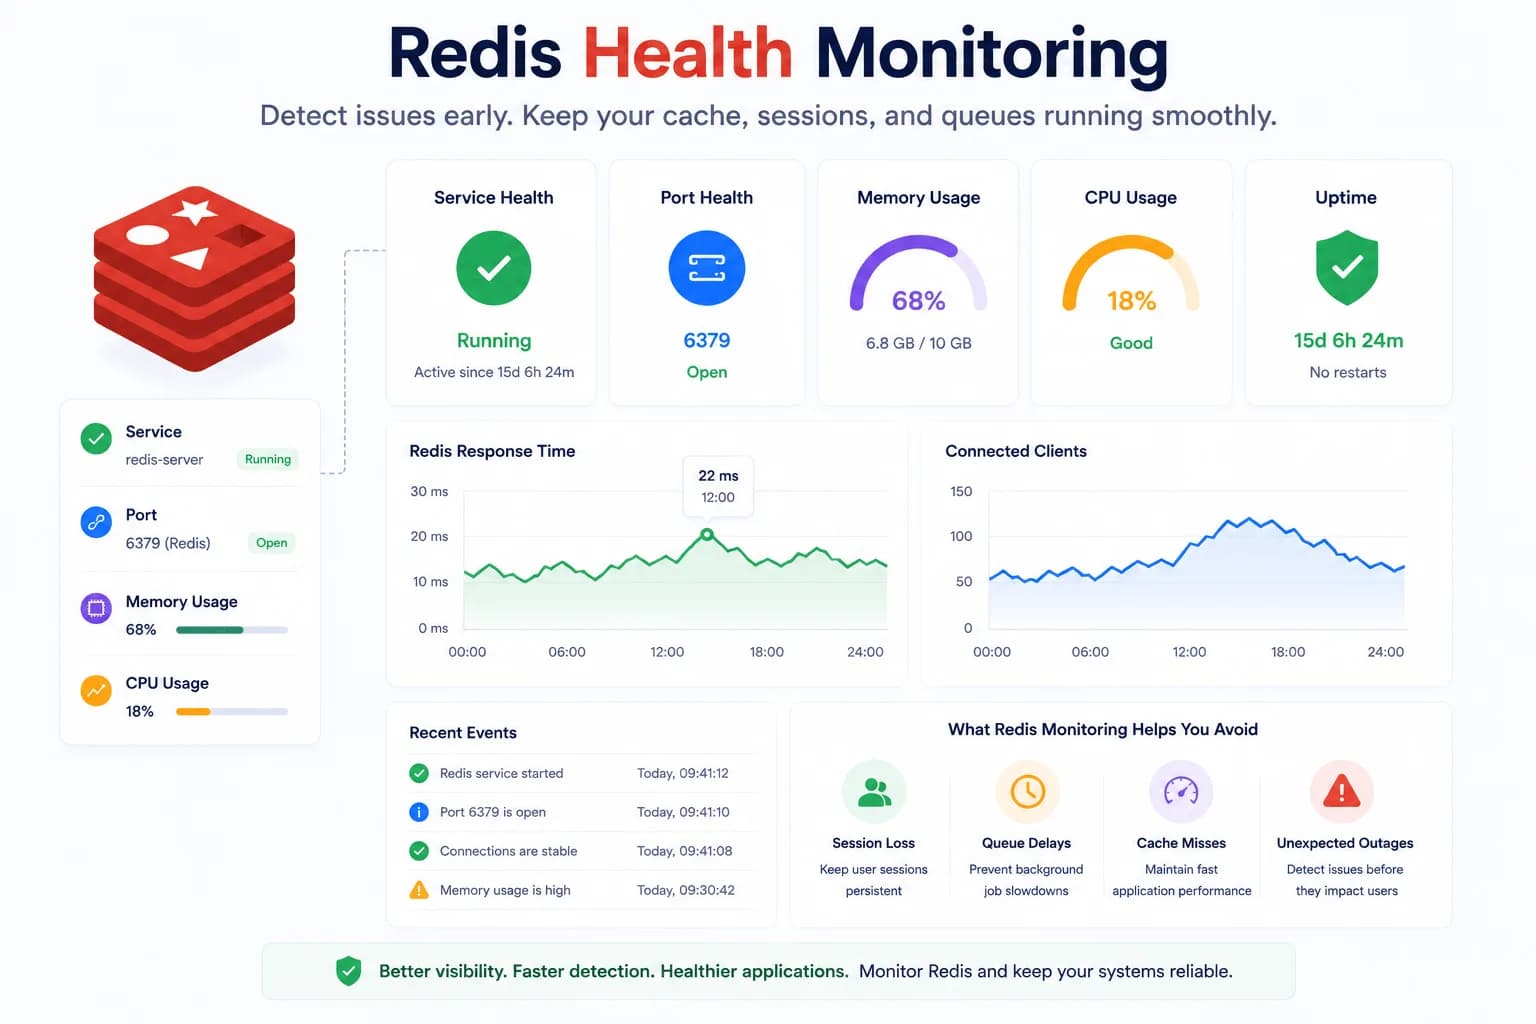
Redis Health Monitoring: What to Watch First...
Redis problems often show up as application symptoms before they look like server incidents. Good monitoring starts with the signals that tell you whether Redis is available, reachable, and supported by a healthy host.
Learn more about Redis Health Monitoring: What to Watch First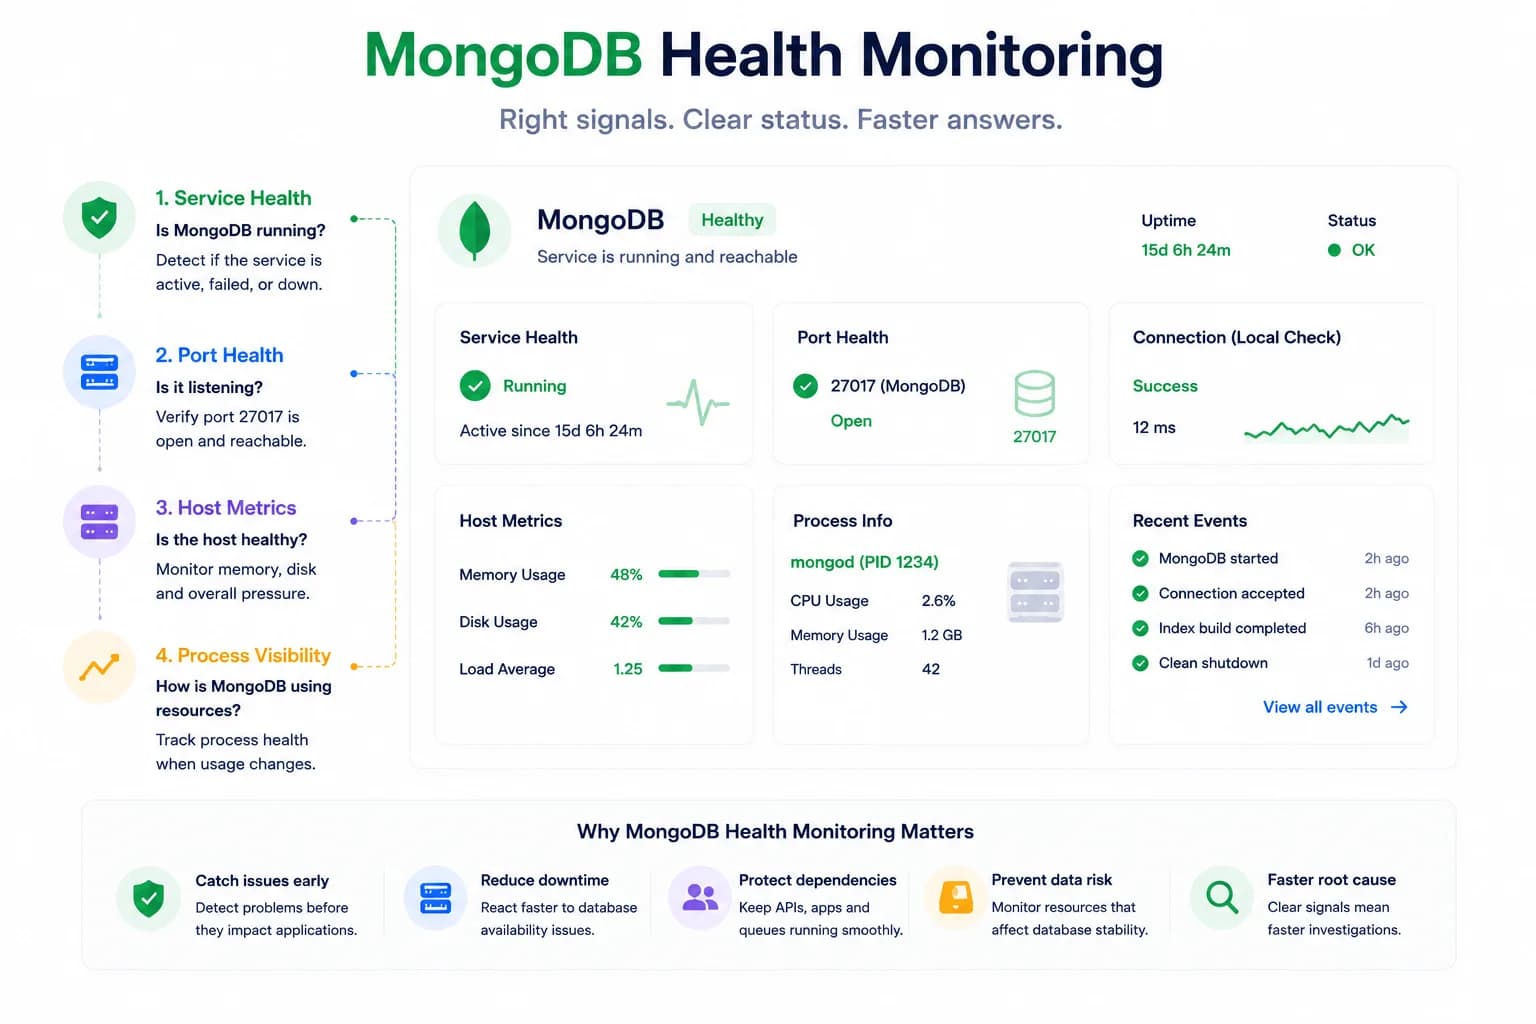
MongoDB Health Monitoring: What to Watch First...
MongoDB issues do not always look like host pressure. Good monitoring starts with the signals that tell you whether the database is available, reachable, and behaving inside the wider system.
Learn more about MongoDB Health Monitoring: What to Watch First