Port Monitoring vs Service Monitoring: What’s the Difference?
- Published On: July 17, 2026
- Category: Server Monitoring
- Read Time: 3 min
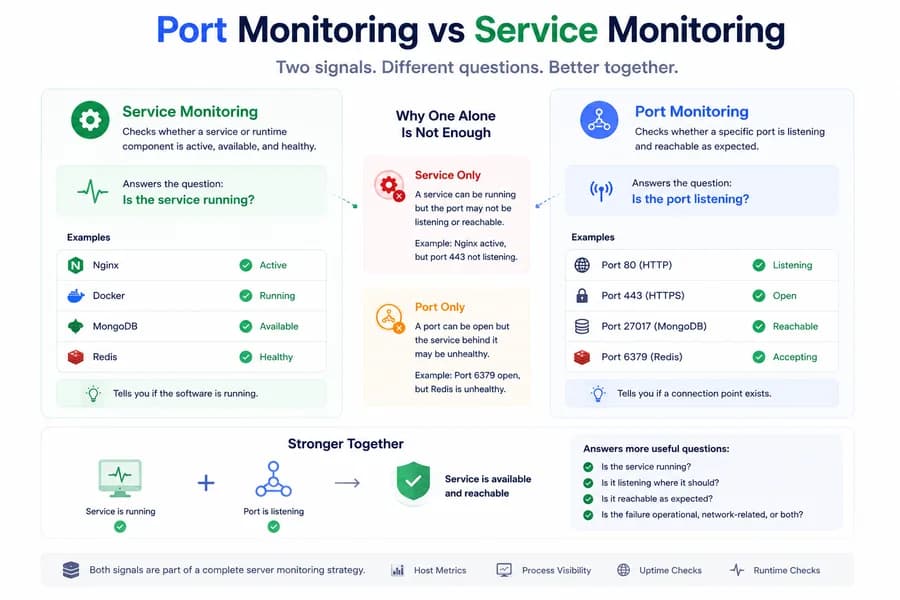
A service can be running while the expected port is not listening correctly. A port can be open while the service behind it is degraded. Good monitoring needs to understand both layers.
Why These Two Signals Get Confused
Port monitoring and service monitoring are closely related, which is exactly why teams often treat them as the same thing. In practice, they answer different questions and reveal different kinds of failure.
If you rely on only one of them, you can easily miss the actual state of a production dependency. For the broader structure around these layers, start with What Is Server Monitoring?.
What Service Monitoring Checks
Service monitoring focuses on whether a named service or runtime component is active, available, or healthy. This is often the most direct signal for understanding whether an important part of the stack is running at all.
Examples include:
- Is Nginx active?
- Is Docker running?
- Is MongoDB available?
- Is Redis healthy?
This layer is especially useful because it maps closely to the software teams actually operate.
What Port Monitoring Checks
Port monitoring focuses on whether a specific local or remote port is listening and reachable in the expected way. This is a more connection-oriented signal. It tells you whether a network entry point exists where you expect it.
Examples include:
- Is port 80 listening?
- Is port 443 open?
- Is port 27017 reachable locally?
- Is port 6379 accepting connections?
This layer is especially useful for confirming whether a service is positioned to receive traffic.
Why Service Monitoring Alone Is Not Enough
A service can appear active while the expected network path is still broken. A process may be running, but the correct port may not be bound, the listener may be misconfigured, or the network behavior may not match what production expects.
In that case, service monitoring alone can create a false sense of health.
Why Port Monitoring Alone Is Not Enough
A port can be open while the service behind it is degraded or unhealthy. A listener may exist, but the software behind it may be unstable, misconfigured, or unable to do useful work. That means port health alone can also create a misleading picture.
This is why open ports should not be treated as proof of service health.
How the Two Signals Work Together
The strongest operational visibility usually comes from combining the two.
When read together, they help teams answer more useful questions:
- Is the service running?
- Is it listening where it should?
- Is it likely to be reachable in the expected path?
- Is the failure operational, network-related, or both?
That combination is much more useful than relying on either signal alone.
Examples in Real Systems
Take a web server as an example. Nginx may be active, but port 443 may not be listening correctly after a config change. In another case, port 443 may be open, but the service behind it may be unhealthy, overloaded, or not routing traffic correctly.
The same logic applies to internal dependencies such as Redis, MongoDB, or other local services. Service state and port state can drift apart, and monitoring needs to capture that difference.
Where This Fits Into Server Monitoring
Port monitoring and service monitoring are both supporting layers inside a broader server monitoring workflow. They work best when interpreted alongside host metrics, process visibility, and runtime-aware checks.
Together, these layers help teams move from generic “something is wrong” alerts to much clearer operational understanding.
How Watchman Tower Uses Both
Watchman Tower uses wt-warden to surface both service health and port health. That means teams can see whether critical services appear active and whether the expected local ports are listening. This creates a more reliable health picture than host metrics alone.
Combined with uptime checks and runtime signals, these two layers help teams investigate infrastructure problems faster and with less guesswork. You can see the product view on the Server Monitoring feature page.
Related Reading
For the service-first case, read Why Service Health Matters More Than Host Metrics Alone. For concrete examples, continue with Nginx health monitoring, MongoDB health monitoring, or Redis health monitoring.
Final Thought
Port monitoring tells you whether a connection point exists. Service monitoring tells you whether the software behind that point appears healthy. Good server monitoring usually needs both because real-world incidents do not always fail cleanly at a single layer.
Check your website's health in seconds
Uptime · Response time · SSL · WordPress detection
Free plan available. No credit card needed.
FAQ
Blog Posts
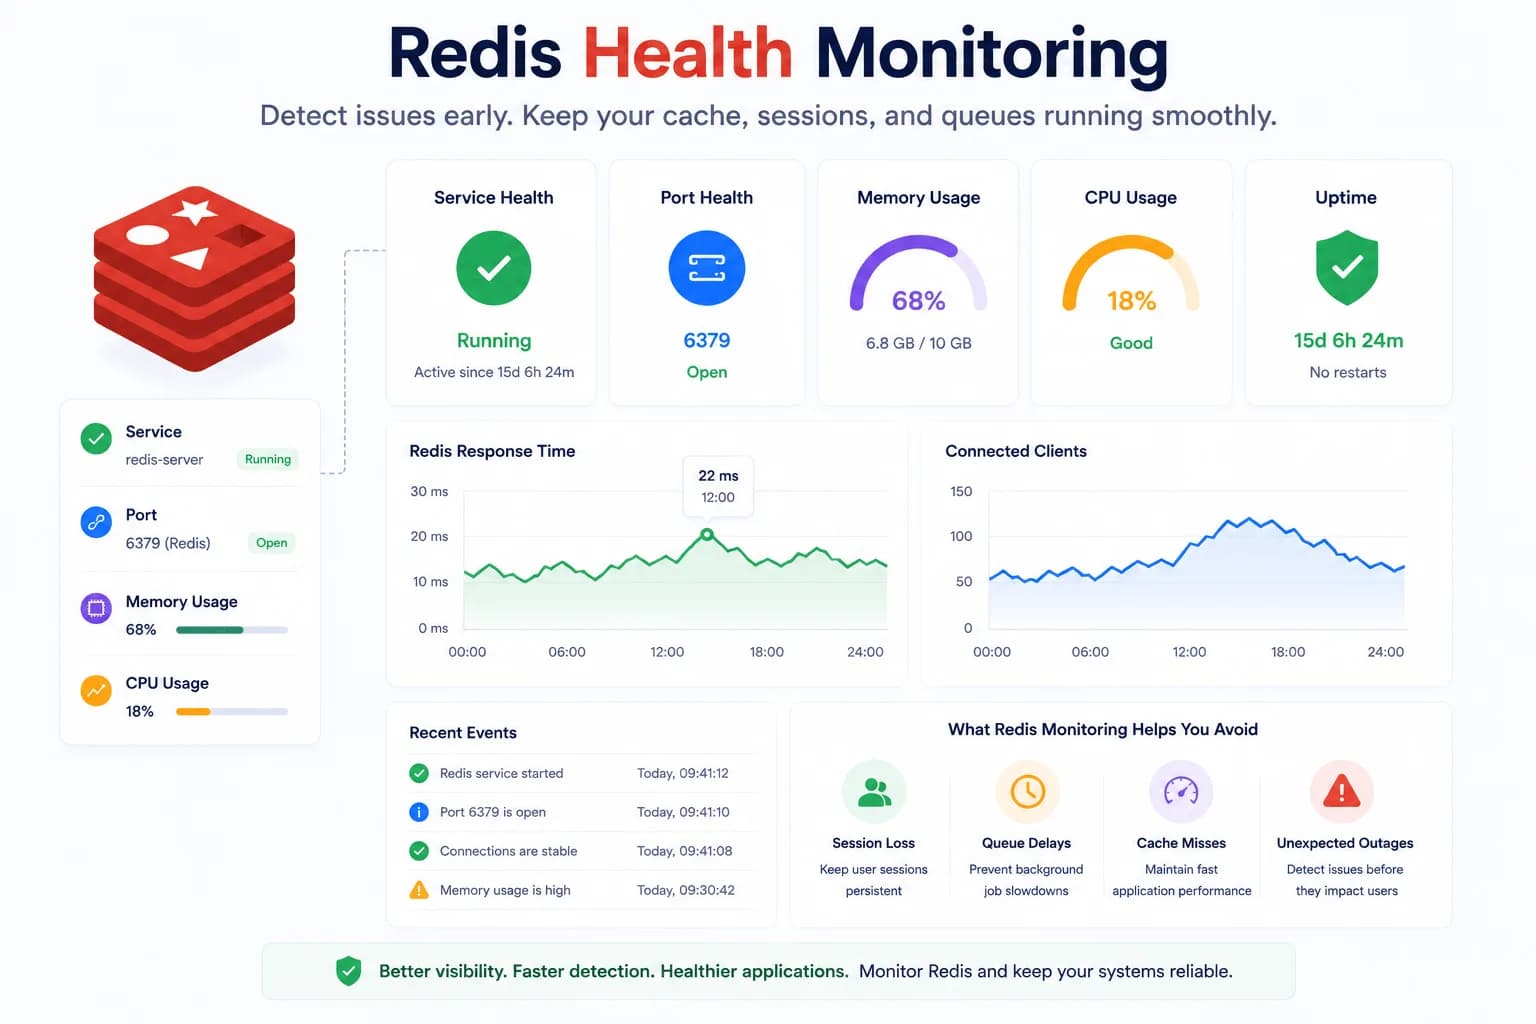
Redis Health Monitoring: What to Watch First...
Redis problems often show up as application symptoms before they look like server incidents. Good monitoring starts with the signals that tell you whether Redis is available, reachable, and supported by a healthy host.
Learn more about Redis Health Monitoring: What to Watch First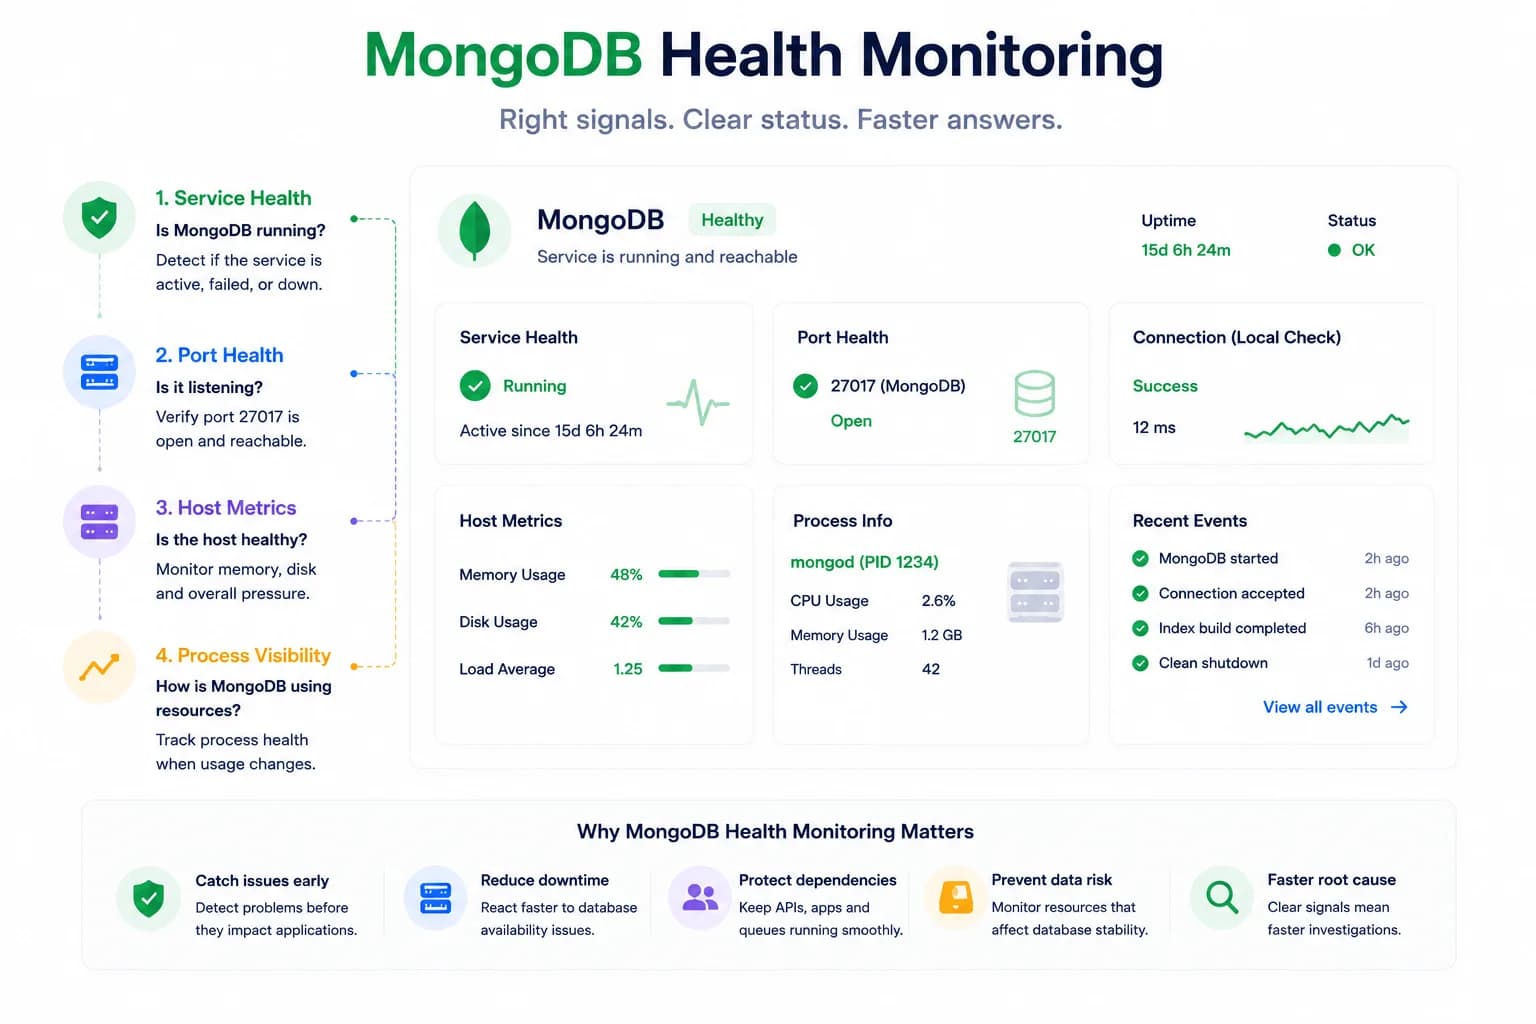
MongoDB Health Monitoring: What to Watch First...
MongoDB issues do not always look like host pressure. Good monitoring starts with the signals that tell you whether the database is available, reachable, and behaving inside the wider system.
Learn more about MongoDB Health Monitoring: What to Watch First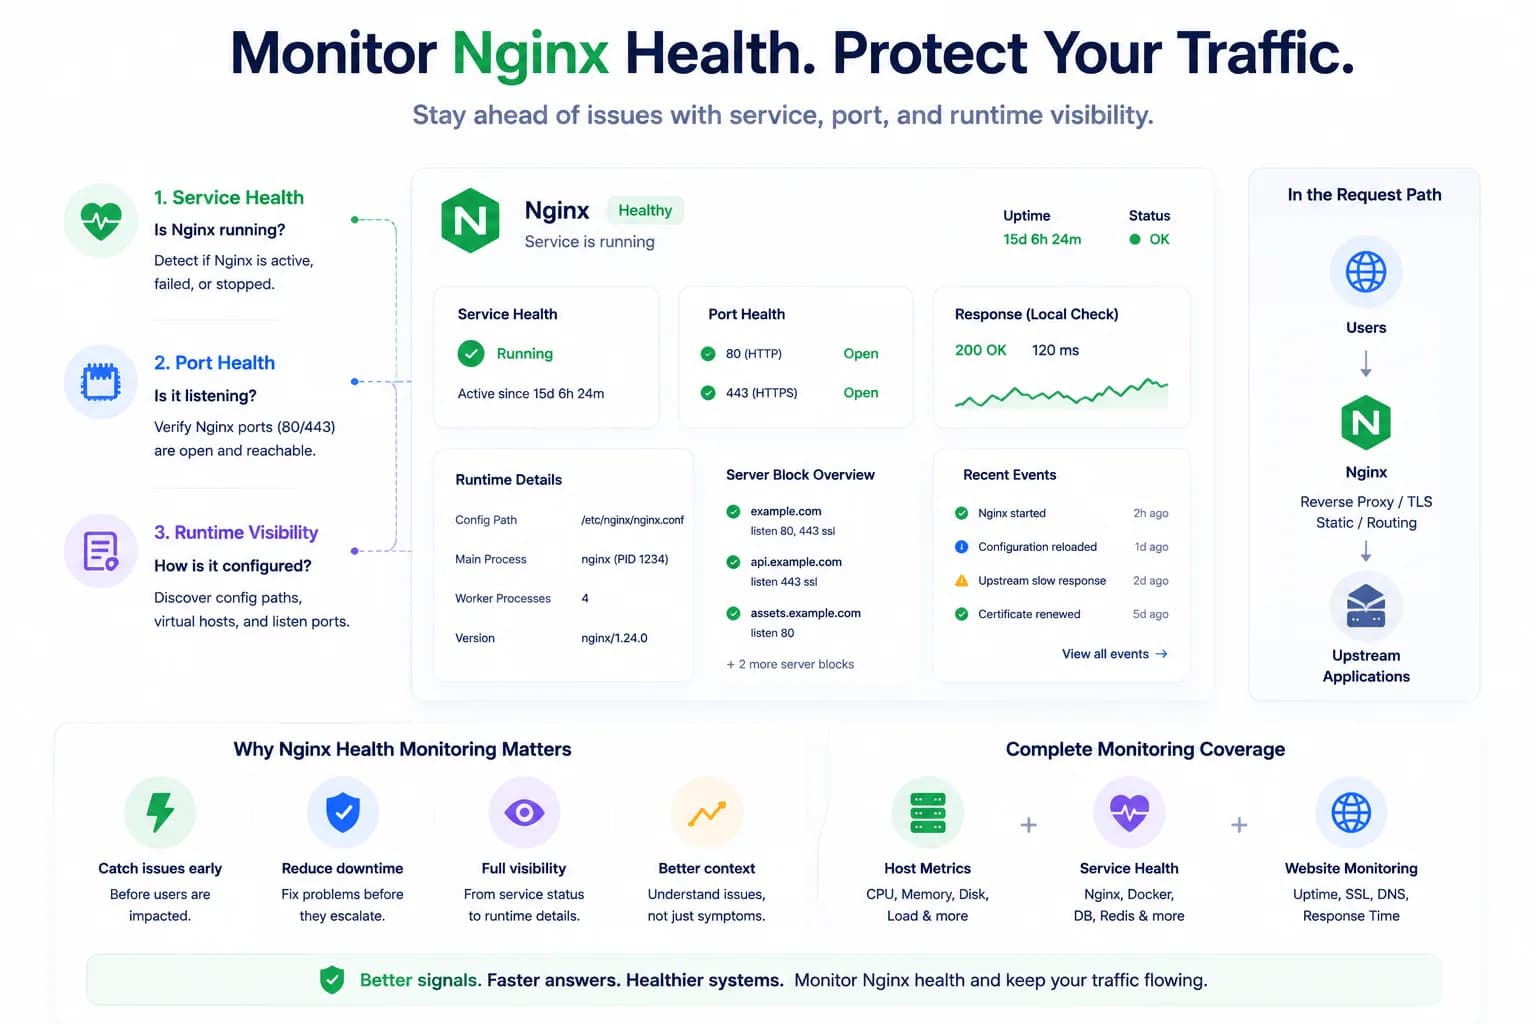
How to Monitor Nginx Health and Detect Serving Issues Early...
Nginx problems do not always begin with a full outage. Good monitoring helps teams detect service failures, port issues, and serving risk before traffic breaks completely.
Learn more about How to Monitor Nginx Health and Detect Serving Issues Early