

Server monitoring guides for service health and runtime visibility
Server monitoring shows what is happening beneath the website: host health, ports, services, runtime behavior, and infrastructure signals. This hub brings together practical guides on server monitoring, service checks, metrics, and lightweight monitoring workflows.
Use it to connect infrastructure signals with website reliability decisions.
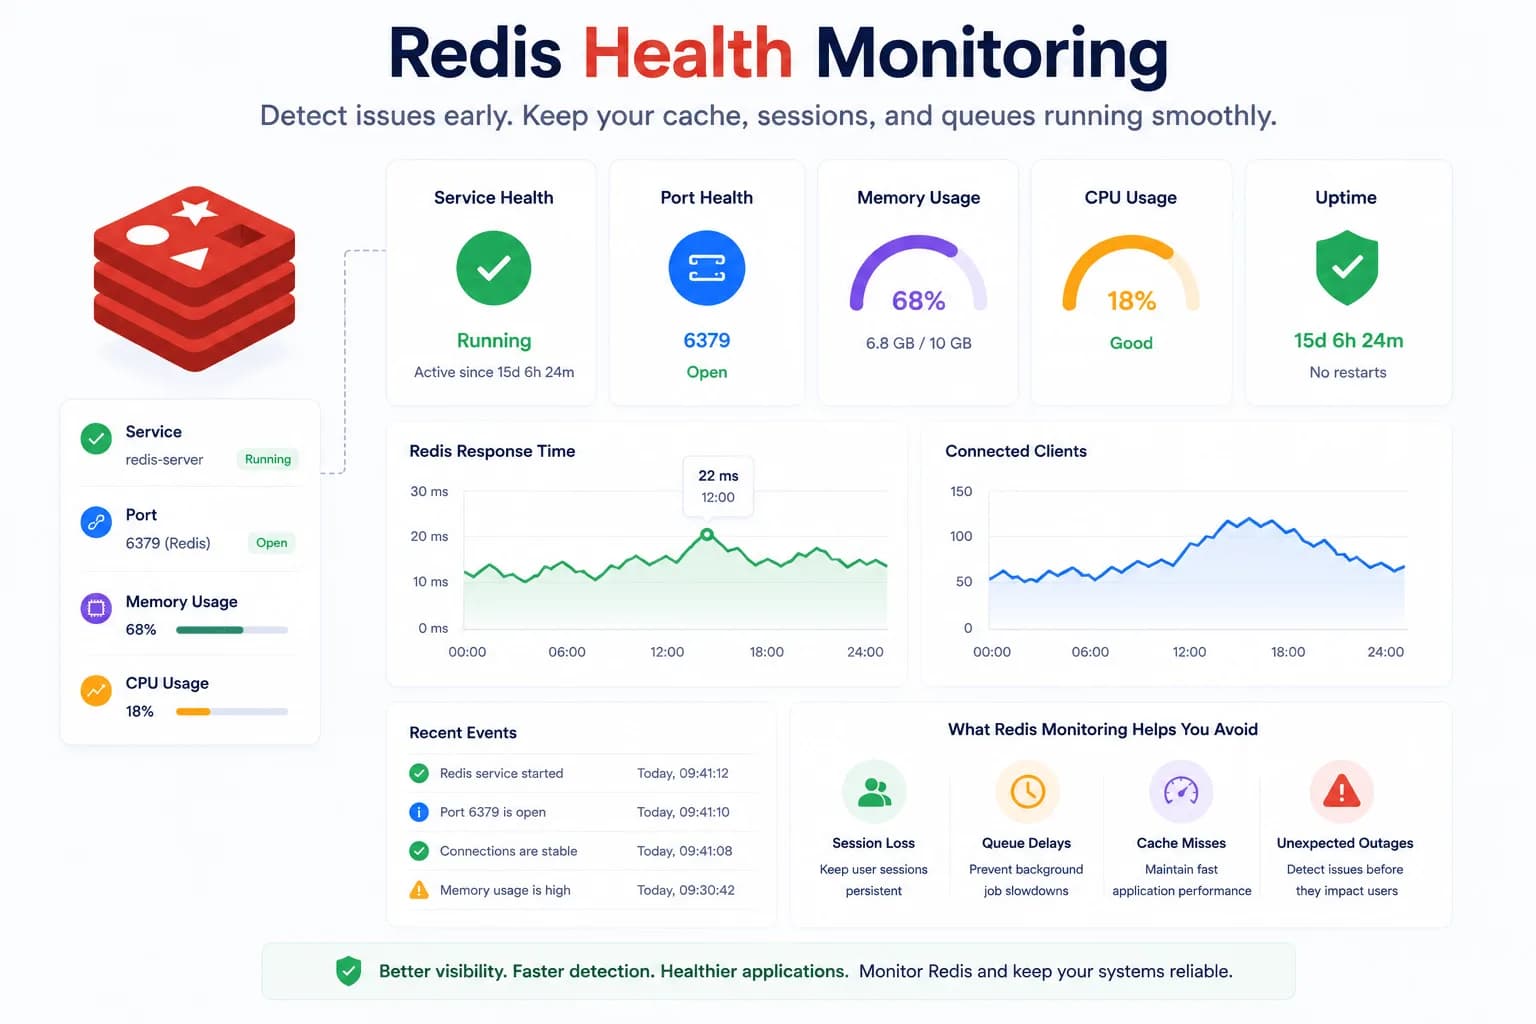
Redis Health Monitoring: What to Watch First
Redis problems often show up as application symptoms before they look like server incidents. Good monitoring starts with the signals that tell you whether Redis is available, reachable, and supported by a healthy host.
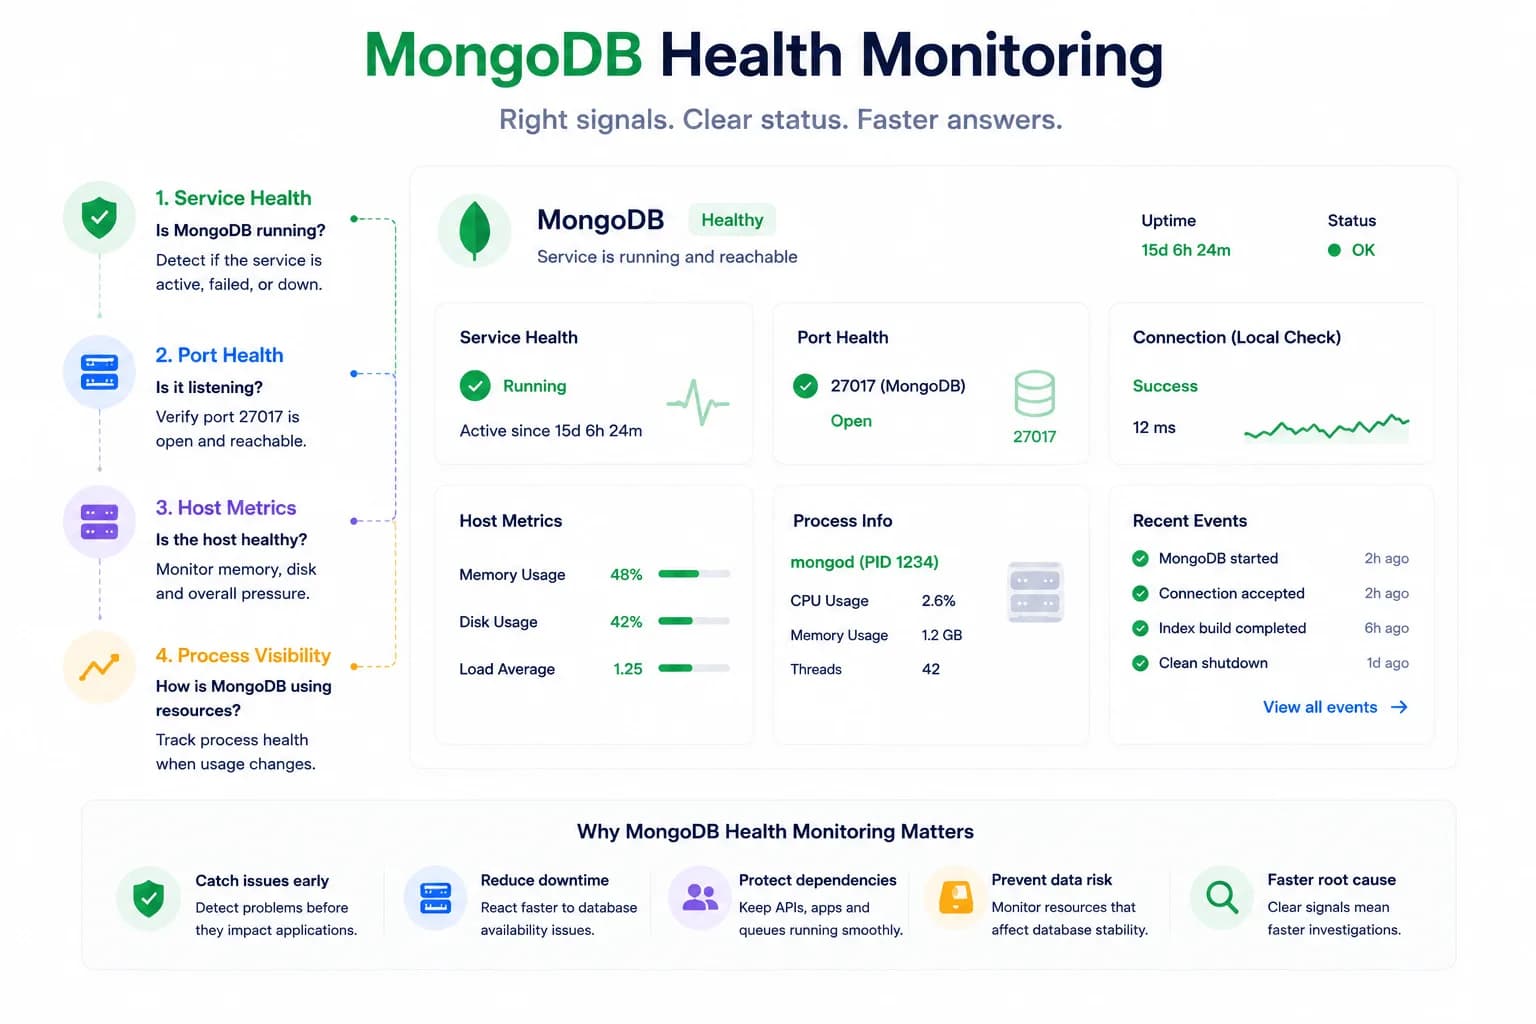
MongoDB Health Monitoring: What to Watch First
MongoDB issues do not always look like host pressure. Good monitoring starts with the signals that tell you whether the database is available, reachable, and behaving inside the wider system.
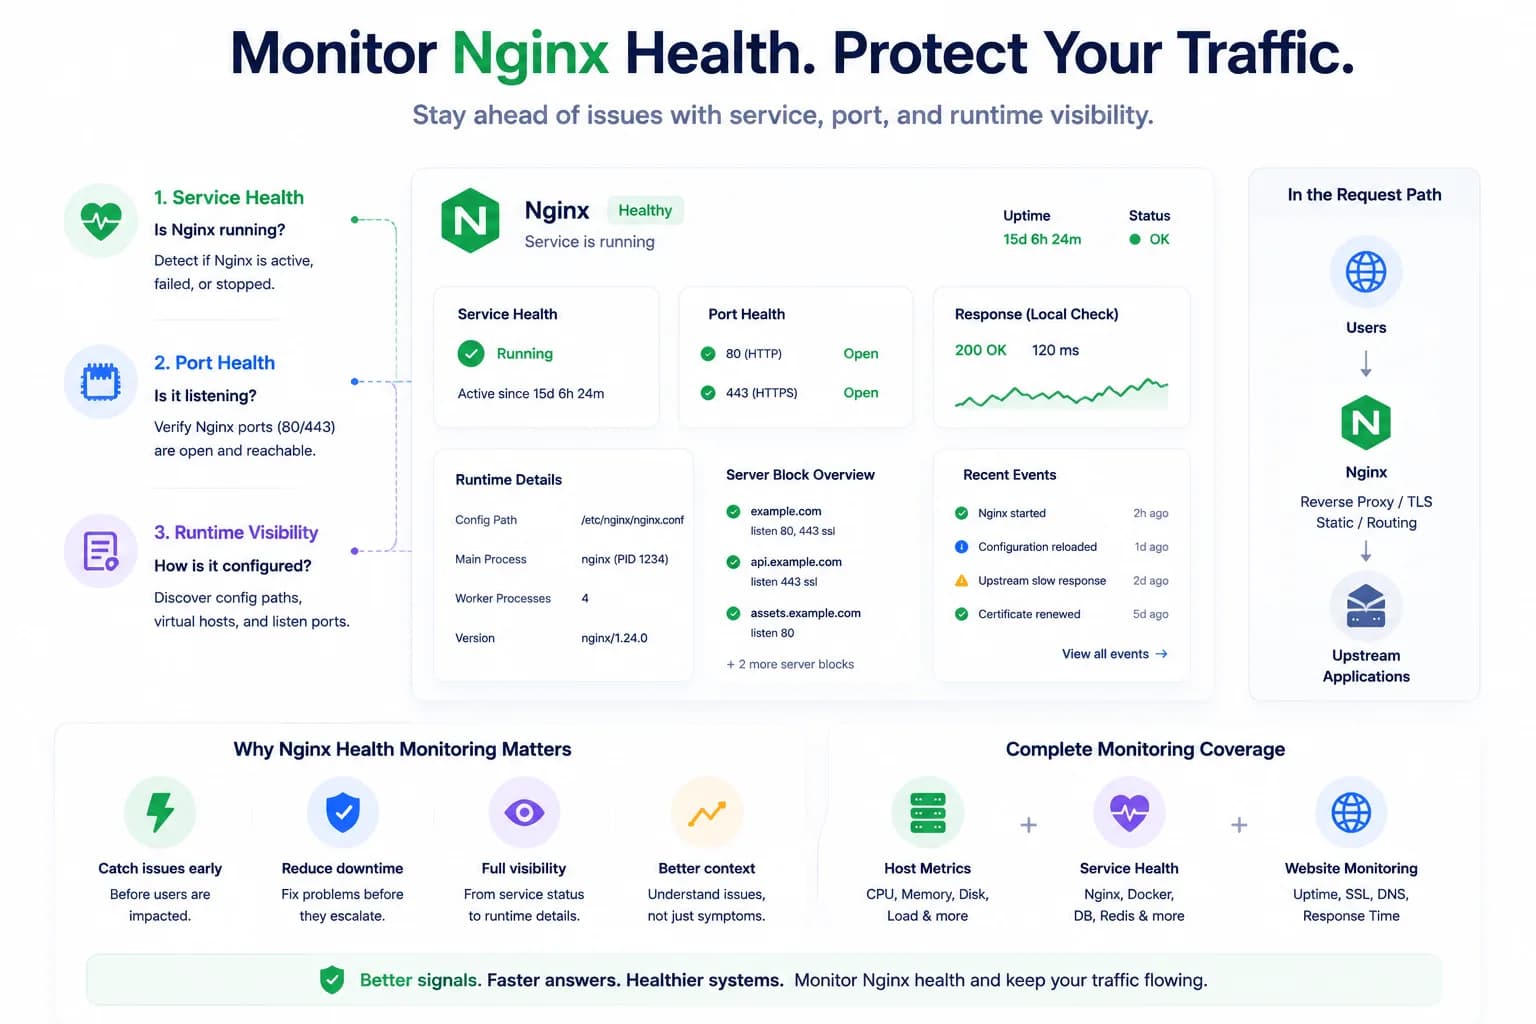
How to Monitor Nginx Health and Detect Serving Issues Early
Nginx problems do not always begin with a full outage. Good monitoring helps teams detect service failures, port issues, and serving risk before traffic breaks completely.
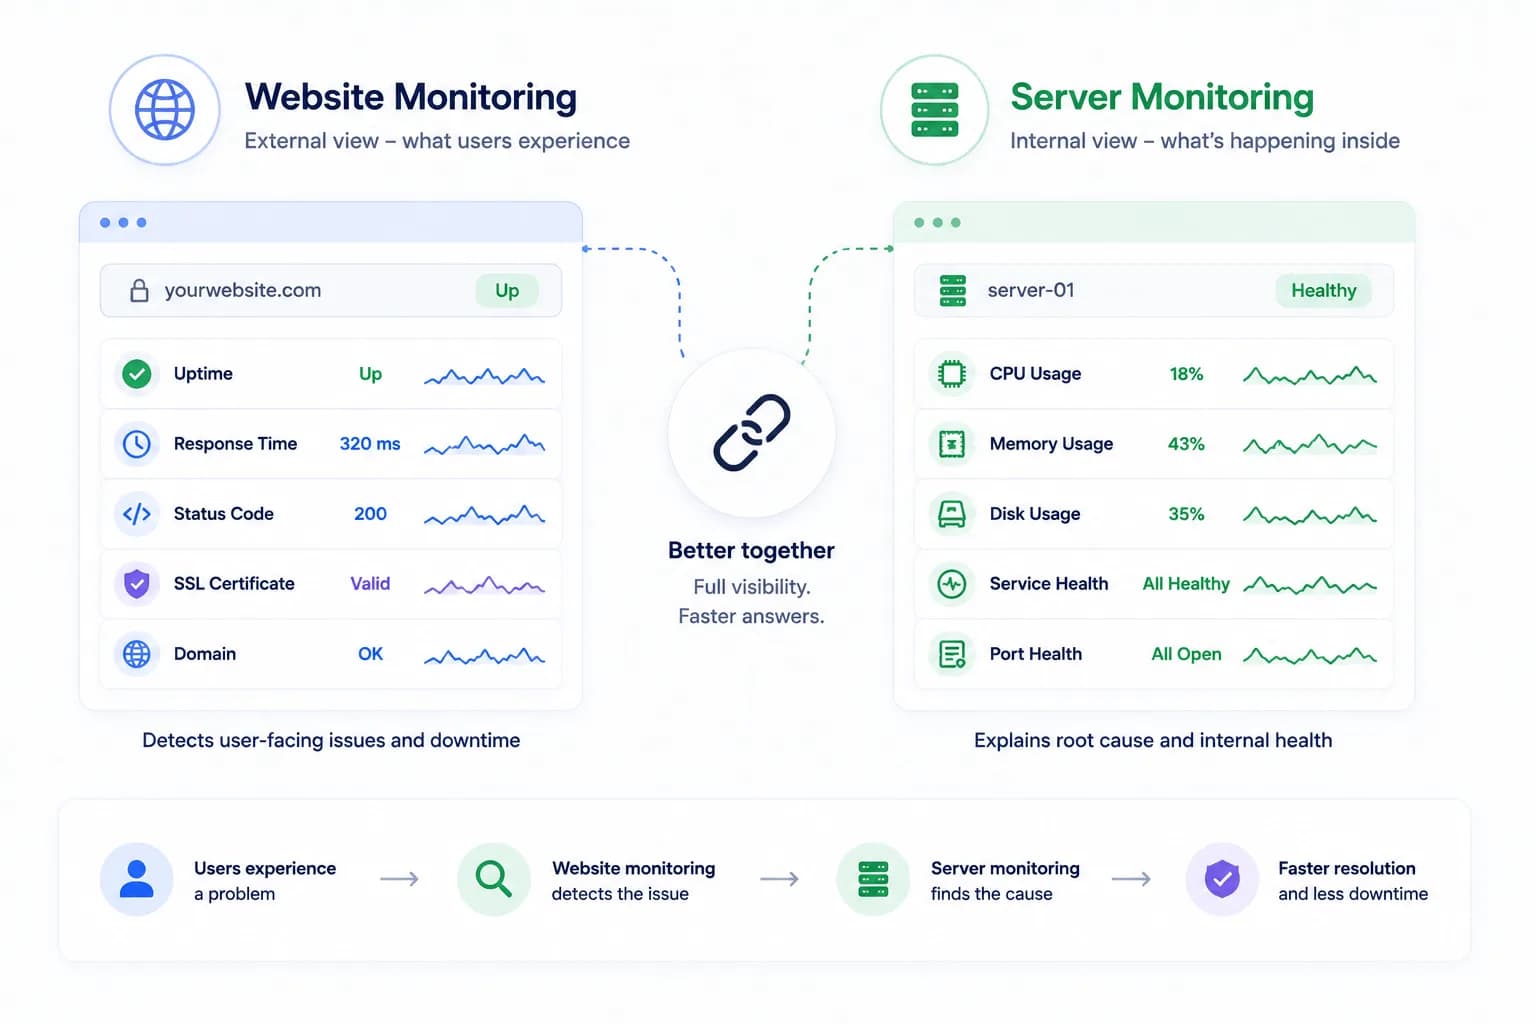
Server Monitoring vs Website Monitoring: Why You Need Both
Website monitoring tells you what users are likely experiencing. Server monitoring tells you what is happening inside the environment serving that traffic. The strongest monitoring strategy needs both.
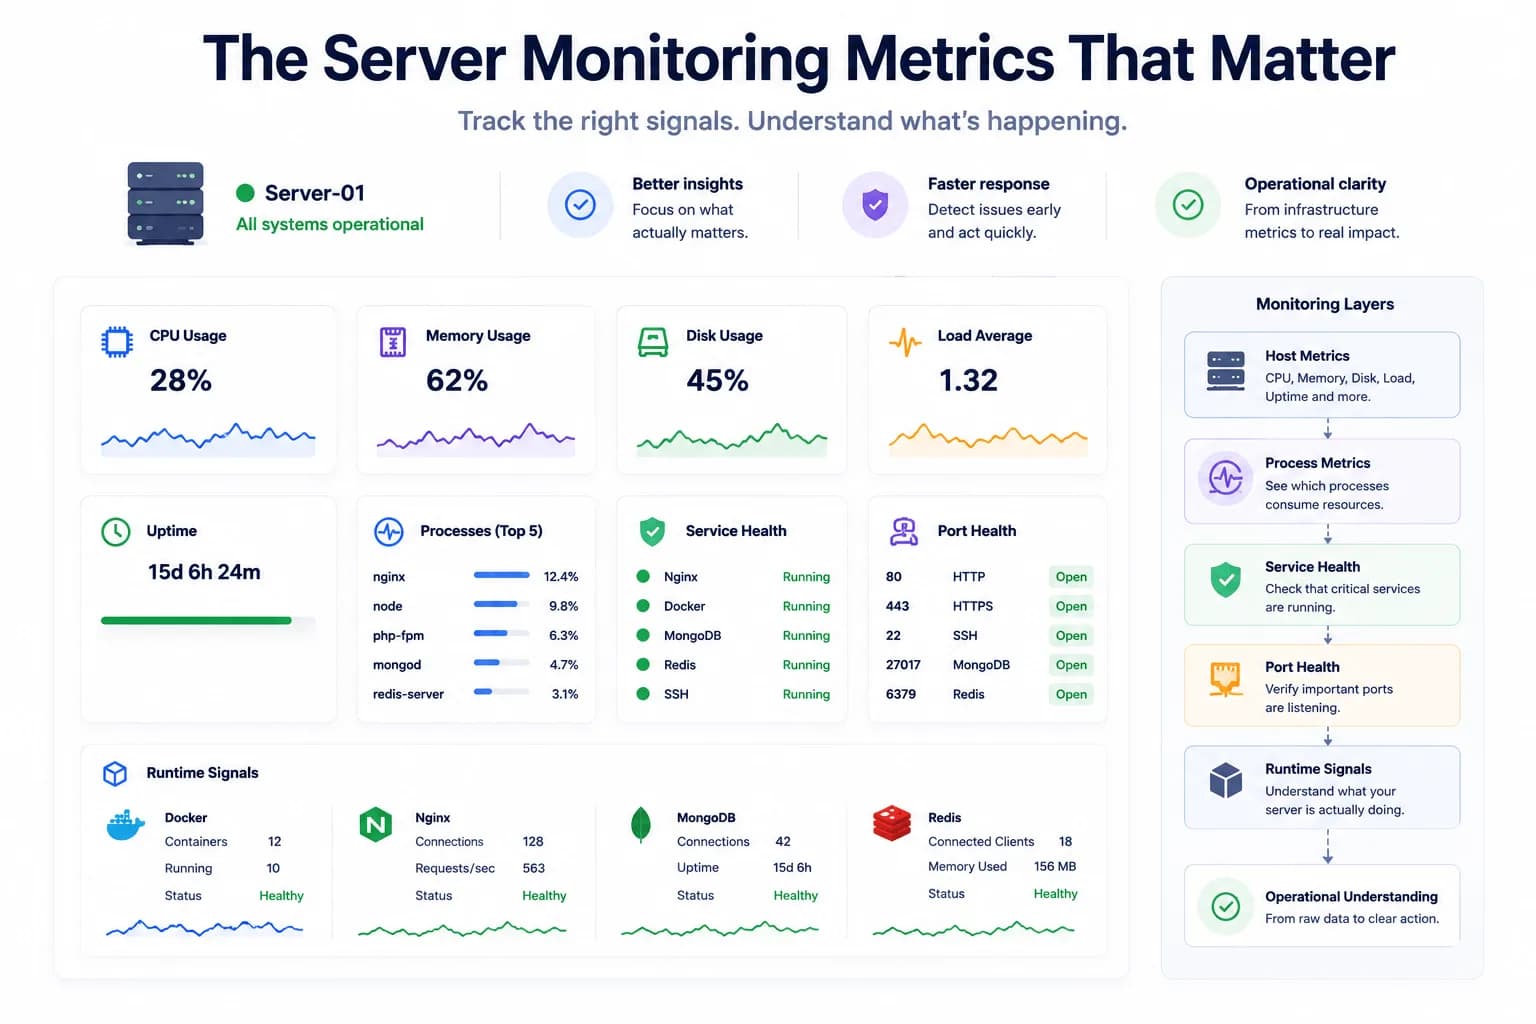
Server Monitoring Metrics That Actually Matter
Good server monitoring is not about collecting more charts. It is about knowing which metrics actually explain risk, pressure, and real operational problems.
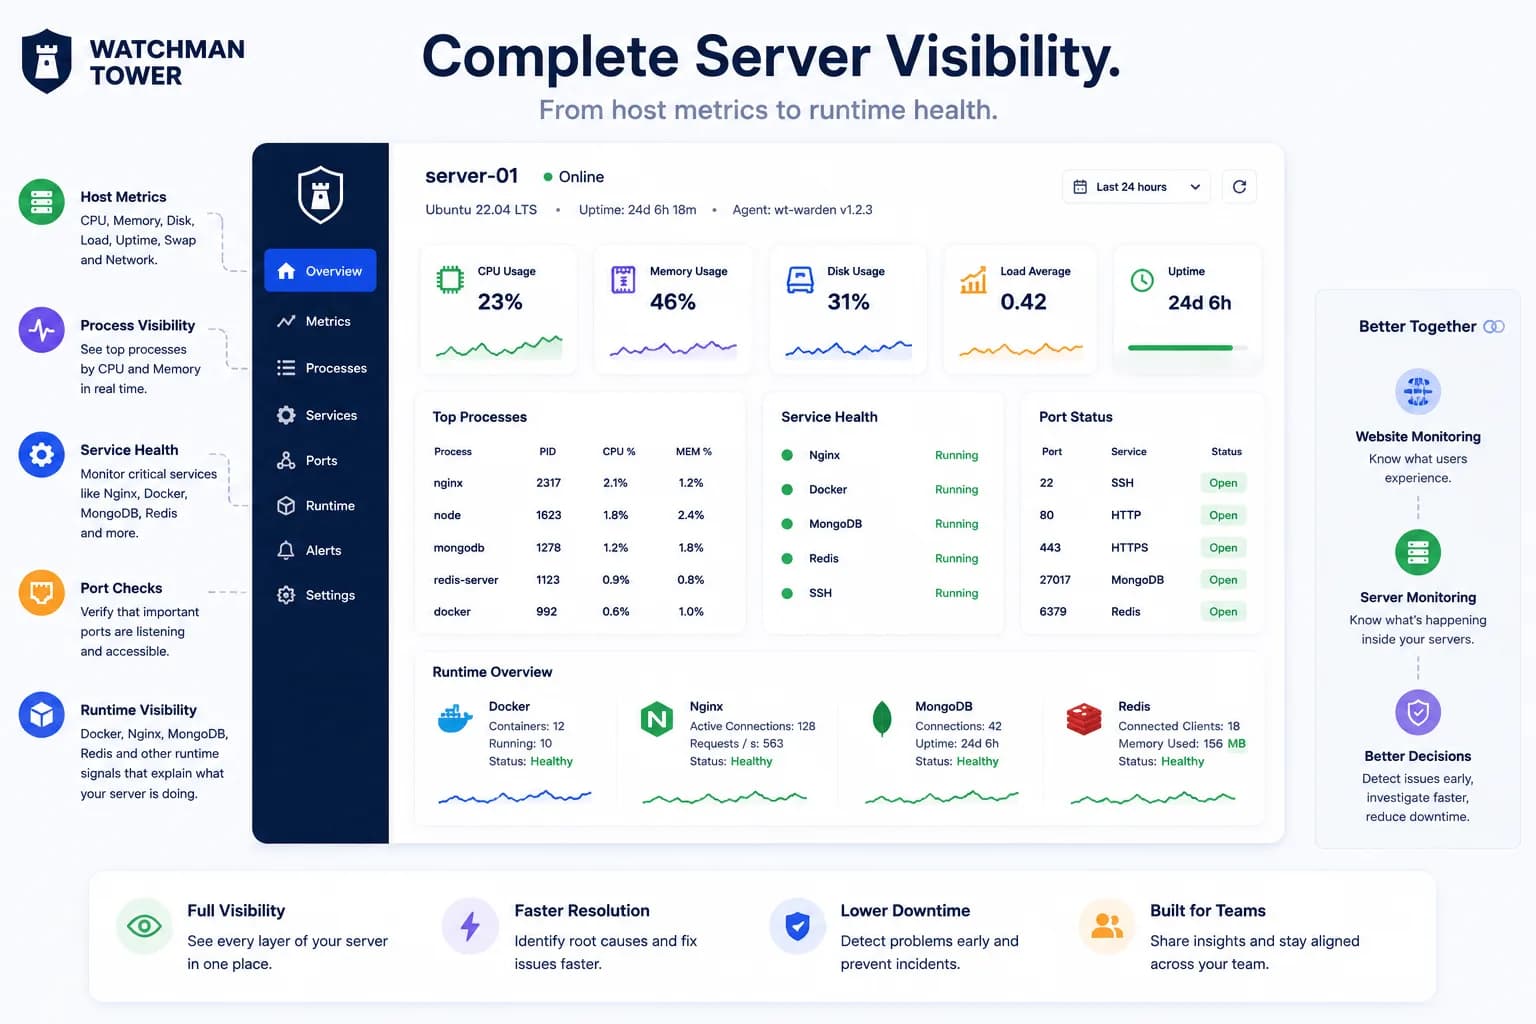
What Is Server Monitoring? Metrics, Services, Ports, and Runtime Visibility
Server monitoring is no longer just about CPU, memory, and disk charts. Modern teams need visibility into processes, services, ports, and the runtime behavior actually serving production traffic.