

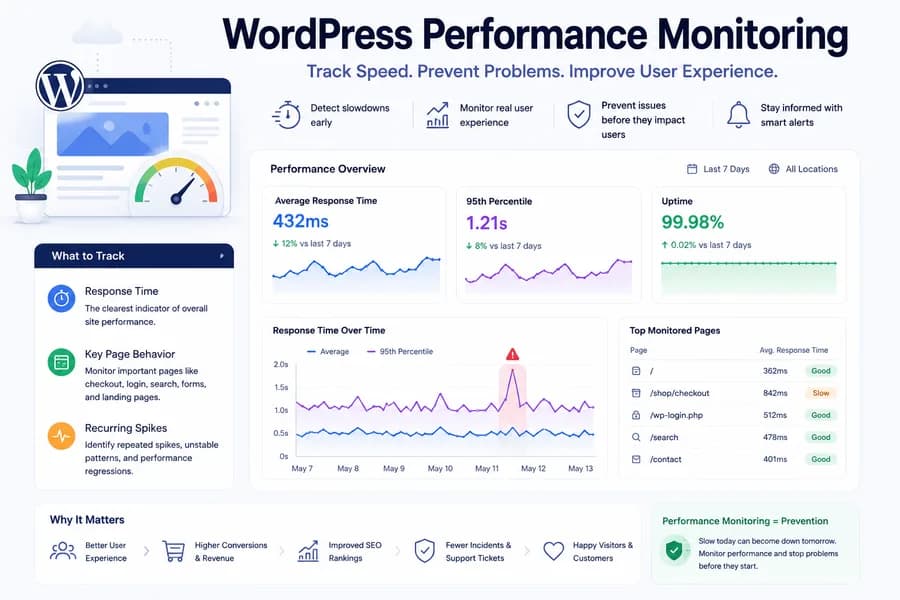
WordPress Performance Monitoring: What You Should Actually Track
- Watchman Tower Team
- Updated: October 4, 2026
- Category: WordPress Monitoring
- Read Time: 9 min
WordPress performance monitoring combines two views: how fast the site answers from outside, and what WordPress reports from inside. This guide explains what each one measures, how slowness is detected, and what neither can prove.
A WordPress site does not need to be down to cost you visitors. It can answer every request with a 200 and still take four seconds to do it. WordPress performance monitoring exists for that gap: it tracks how fast the site responds over time, and it collects the signals that help explain a slowdown when one appears.
This guide covers what to measure from outside the site, what WordPress can report from inside, how slowness is actually detected, and what Watchman Tower provides for each. If you are still setting up outage detection, start with WordPress downtime monitoring.
What WordPress performance monitoring is
Performance monitoring answers one question on a schedule: how long does this site take to respond, and is that changing? A single speed test gives you a number. Monitoring gives you a history, and the history is what shows a regression after a plugin update, a slow hour every night when backups run, or a host that has been getting slower for three weeks.
For WordPress, the useful version has two halves:
- External signals measured by requesting the site over the network, the way a visitor reaches it.
- Internal signals reported by WordPress itself: memory, database, cron, caches and updates.
The first half tells you that the site is slow and where on the path the time is spent. The second half gives context about the state of the WordPress installation at that moment.
How performance monitoring fits with uptime monitoring
Uptime monitoring answers whether the site is available. Performance monitoring answers whether it is responding as fast as it normally does.
- Uptime monitoring catches hard failures: timeouts, DNS errors, 5xx responses, certificate problems.
- Performance monitoring catches slowdowns, unstable response times and gradual degradation.
They use the same checks. Every uptime check already has a duration, so the two are different readings of one measurement. You need both readings, because a site that is up and slow never shows on an uptime report.
What external monitoring can show you
External checks request the site from outside your hosting environment. That matters because visitors do not experience WordPress from inside wp-admin. They experience DNS, the TLS handshake, any redirects, and then the server's answer.
Response time
This is the baseline metric: the total time from starting the request to receiving the response. Watch it as a series, and watch more than the average. A median shows what is typical. High percentiles such as P90 and P99 show how bad the slow moments are, and an average hides both.
Where the time goes
A response time can be split into phases: DNS lookup, TCP connection, TLS handshake, and time to first byte. The split changes what you do next. Slow DNS points at the DNS provider. A slow TLS handshake or connection points at the network or the edge. A long time to first byte points at the server, which on WordPress usually means PHP and the database.
Differences between regions
A site can be fast from one continent and slow from another. If one region is consistently several times slower than the rest, the site itself is usually fine and the path from that region is not. Without checks from more than one location, that looks the same as a slow server.
Redirects
A chain such as http to https to www adds a full round trip per hop before the page is even requested. It is easy to miss because the final page looks fast when tested directly.
Which pages to check
The homepage is often the best-cached page on a WordPress site, which makes it the least representative. Pages that skip the page cache behave differently:
- cart and checkout on WooCommerce
- login and account pages
- search results
- forms and campaign landing pages
Add a separate monitor for the pages that matter. A cached homepage can stay fast while every uncached request is slow.
What external checks do not measure
A monitoring check measures the server's response. It does not load images, run JavaScript or render the page, so it does not report Core Web Vitals or page weight. Those belong to browser-based tools such as PageSpeed Insights. For the difference between the two kinds of measurement, see page speed monitoring.
What WordPress-specific signals add
External checks tell you the site is getting slower. Signals from inside WordPress describe the state of the installation when that happens. A monitoring plugin can report them on a schedule. For how the two approaches compare, read WordPress monitoring plugin.
- PHP memory usage against the limit. A request close to its memory limit is one step from a fatal error.
- Database check. Whether WordPress can reach and query its database.
- REST API check. Whether the REST API answers, which the block editor and many plugins depend on.
- Cron status. Whether scheduled events are running or piling up overdue. Stalled cron delays scheduled posts, emails and cleanup jobs.
- Autoloaded options size. Options marked autoload are read on every page load. WordPress's own Site Health check flags them above 800 KB.
- Cache status. Whether OPcache is enabled and whether a persistent object cache such as Redis or Memcached is in use.
- Pending updates and the active plugin list. Context for "what changed" when response times shift.
How slowness is detected
"Slow" needs a definition before it can be monitored. There are two common ones.
A fixed threshold says a response over, for example, two seconds is slow. It is simple, and wrong for most sites: too strict for a heavy store, too loose for a static brochure site.
A comparison with the site's own normal says a response is slow when it is well above what this site usually does. A site that normally answers in 300 ms and now takes 900 ms has a problem, even though 900 ms would pass a fixed threshold.
Two more rules keep the result honest. One slow check is not a slowdown, so the condition has to repeat. And one slow location is not a slow site, so more than one region has to agree.
What Watchman Tower measures
WordPress Monitoring in Watchman Tower uses both halves. External checks run for every site. The WordPress plugin is optional and adds the internal signals.
From outside
- Each site is checked from three regions: Frankfurt, New York and Singapore.
- Response time is the full wait including redirects. Charts show the slowest and fastest region, with median, P90, P99, minimum and maximum over 1, 7, 15 or 30 days.
- The latest check from each region is broken down into DNS, TCP, TLS and time to first byte.
- A region is treated as slow when it takes at least 1.5 times its own usual response time and at least 300 ms longer. The site is marked degraded only when at least two regions agree across consecutive checks.
- Severe, sustained slowness is recorded as a "Slow responses" incident with the phase that grew: DNS, connection, TLS or origin latency.
- A region that stays several times slower than the others is shown separately as a regional reachability issue, and a slow redirect chain as redirect overhead.
Slowness on its own does not send a notification. Alerts are sent for availability incidents; slow periods appear as degraded status, in the charts and in the incident list.
From inside, with the plugin
The plugin reports every five minutes by default. What each signal does:
| Signal | What Watchman Tower does with it |
|---|---|
| Database check fails | Opens an incident and alerts, after two consecutive failed reports |
| REST API check fails | Opens an incident and alerts, after two consecutive failed reports |
| Plugin stops reporting | Sends a notice, unless the site is also down from outside, in which case the silence is explained by the outage |
| WordPress core update pending | Sends a notice |
| PHP memory at 70% of the limit or more | Shown as memory pressure. Listed as a contributing factor if the site is also slow from outside |
| Cron events overdue | Shown as stalled cron. Listed as a contributing factor if the site is also slow from outside |
| Autoloaded options size, OPcache, object cache, plugin and theme updates, active plugin list | Displayed for context. No alert |
The two halves also check each other. If external checks fail while the plugin keeps reporting and its database check passes, the incident says the server is alive and the failure is likely at the network, DNS or edge layer.
What these signals cannot tell you
Internal signals narrow an investigation. They do not prove a cause.
- High memory during a slowdown is a lead. The memory figure is a sample from one request, not a measurement of the whole site.
- A large autoload size is a known risk. It is not evidence that today's slowdown comes from it.
- A pending plugin update is context. It says nothing about that plugin's speed.
Watchman Tower does not measure page generation time, slow database queries, or the cost of individual plugins. To find which plugin or query is slow, use a profiling tool such as Query Monitor on a staging copy. Monitoring tells you when the slowdown started and which layer it sits in; profiling tells you which code is responsible.
Where performance monitoring matters most
- WooCommerce sites: cart and checkout skip the page cache, so they slow down first and cost the most.
- Agency-managed sites: a response-time history shows a regression before the client reports it. See WordPress Monitoring for Agencies.
- Campaign pages: a slow landing page wastes paid traffic for as long as nobody notices.
- Membership and login-heavy sites: logged-in pages are uncached and degrade before the public homepage does.
Practical recommendation
- Track response time continuously and read the median and the high percentiles together.
- Monitor at least one uncached page in addition to the homepage.
- Check from more than one region before concluding the server is slow.
- Collect the internal signals so that a slowdown arrives with context.
- Treat those signals as leads to investigate, and confirm the cause with profiling.
Slow periods often come before outages, so the same history helps with prevention. Continue with How to Prevent WordPress Downtime.
Next steps
Free plan available. No credit card needed.
FAQ
Is uptime monitoring enough for WordPress performance issues?v
What is the most important WordPress performance metric to track?v
What is the difference between external and internal WordPress monitoring?v
Can a monitoring tool tell me which plugin is slowing down my WordPress site?v
Does response time monitoring measure Core Web Vitals?v
Which WordPress signals does Watchman Tower alert on?v
Blog Posts
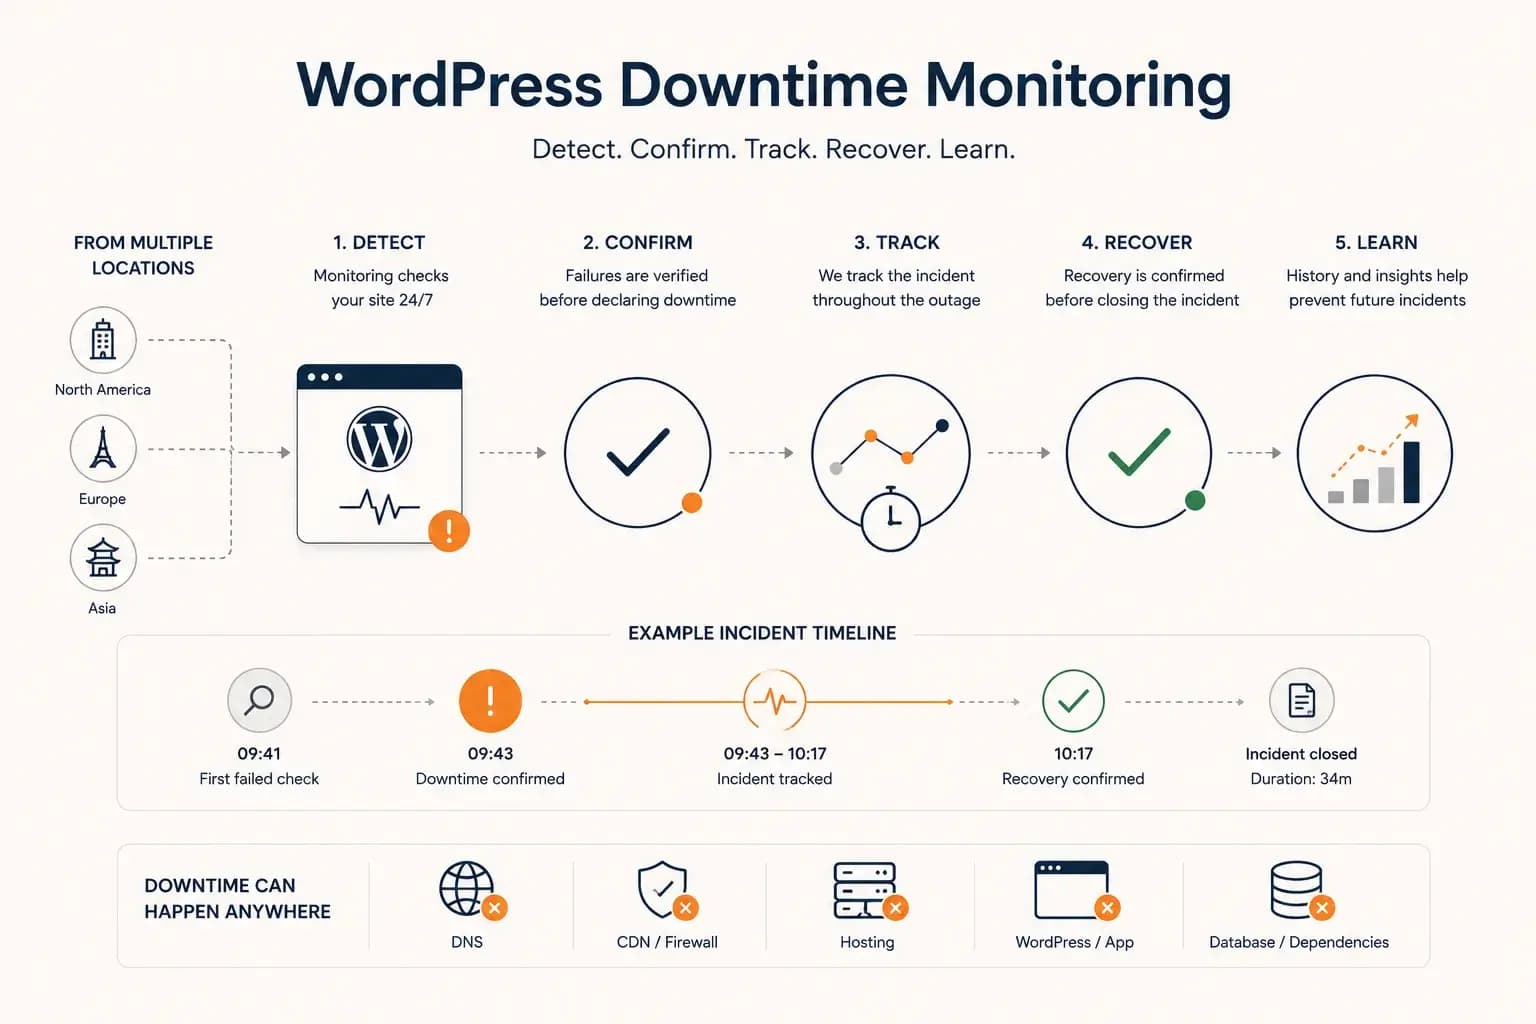
WordPress Downtime Monitoring: How to Detect and Track Outages...
WordPress downtime monitoring goes beyond detecting a failed request. Learn how to confirm real outages, track incidents, verify recovery, and use downtime history to improve reliability.
Learn more about WordPress Downtime Monitoring: How to Detect and Track Outages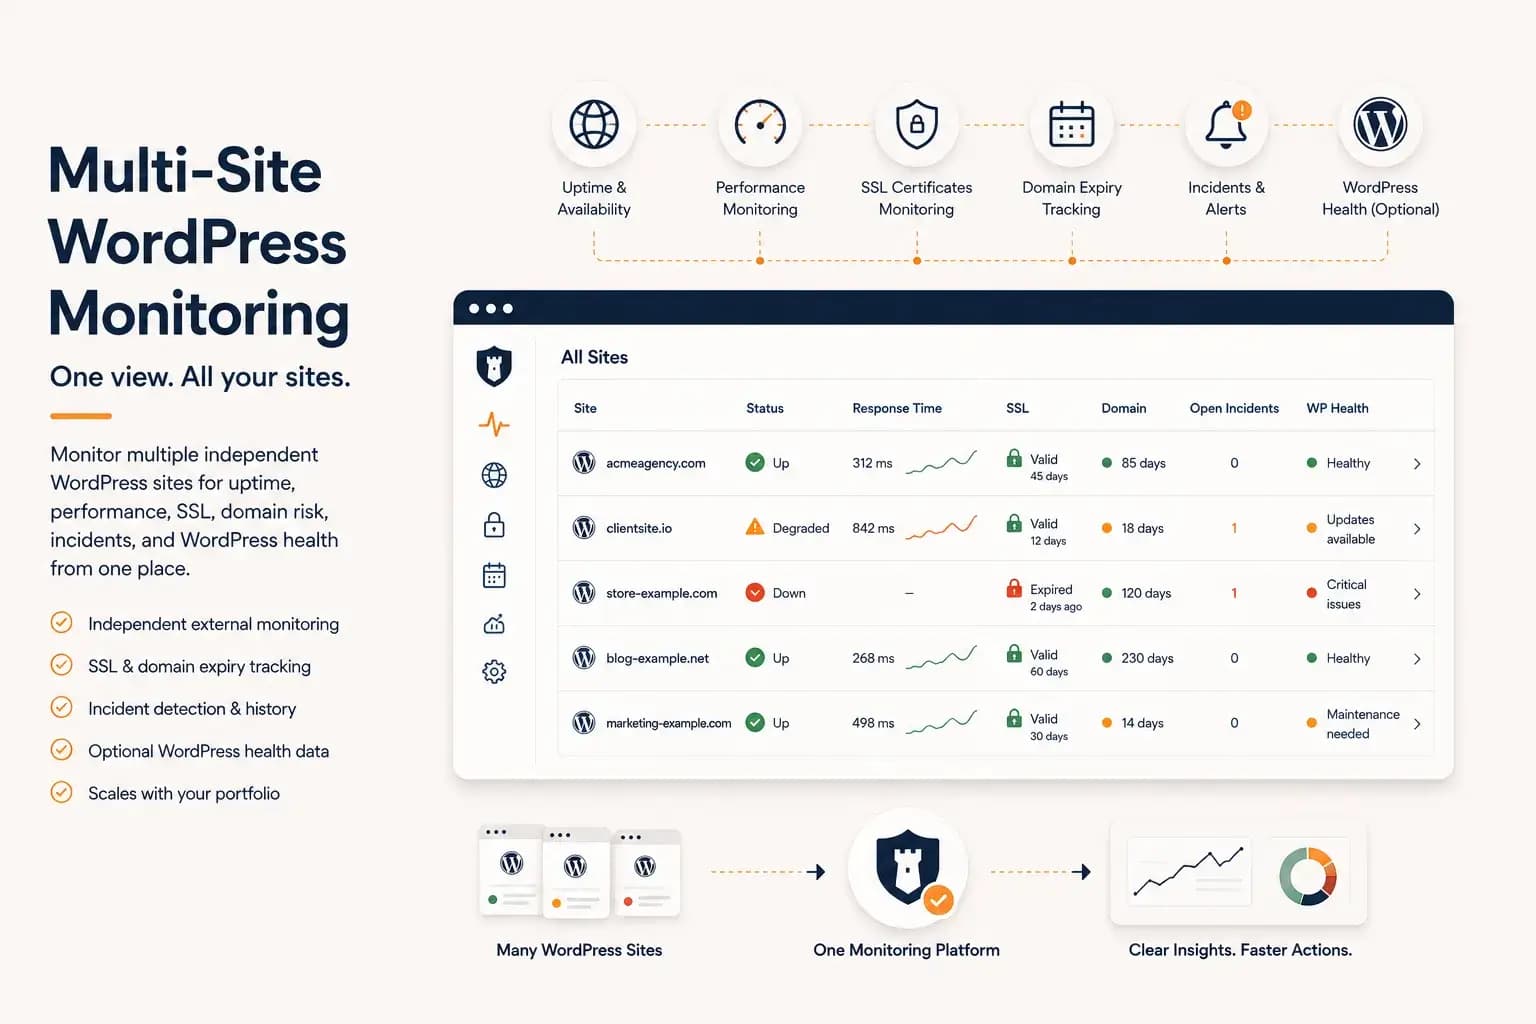
WordPress Multi-Site Monitoring: Manage Multiple Sites Efficiently...
Managing multiple WordPress websites requires more than uptime checks. Learn how to centralize monitoring, reduce operational overhead, and gain visibility into performance, SSL, domains, and WordPress health from a single dashboard.
Learn more about WordPress Multi-Site Monitoring: Manage Multiple Sites Efficiently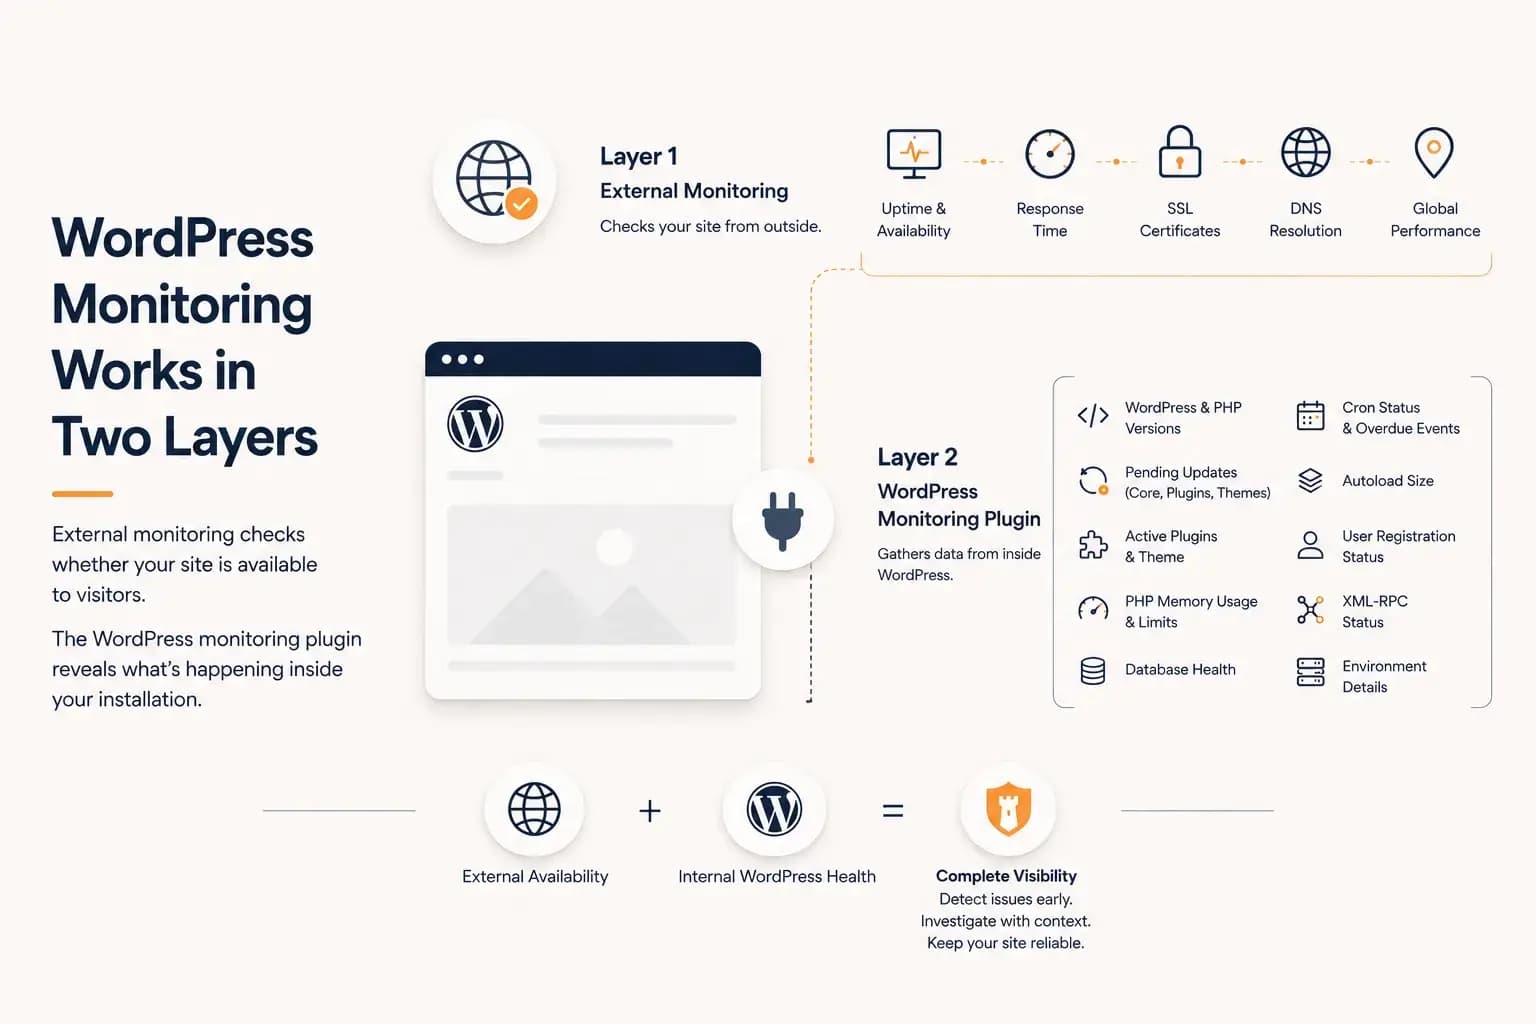
WordPress Monitoring Plugin: What It Tracks and What It Misses...
A WordPress monitoring plugin reveals application-level health such as updates, PHP memory, database status, cron activity, and plugin inventory. This guide explains what it can monitor, what it cannot see, and why it works best alongside external monitoring.
Learn more about WordPress Monitoring Plugin: What It Tracks and What It Misses