

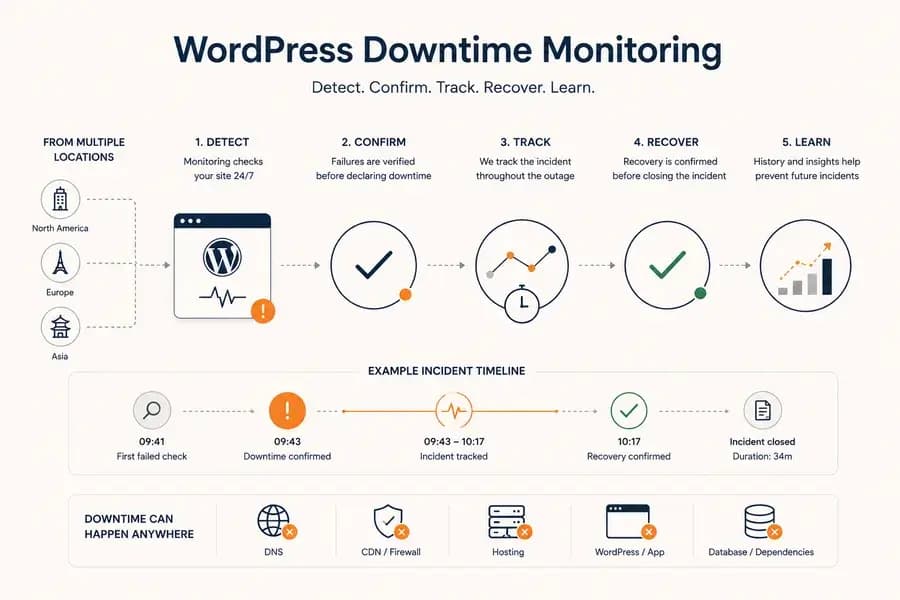
WordPress Downtime Monitoring: How to Detect and Track Outages
- Watchman Tower Team
- Updated: August 11, 2026
- Category: WordPress Monitoring
- Read Time: 9 min
WordPress downtime monitoring goes beyond detecting a failed request. Learn how to confirm real outages, track incidents, verify recovery, and use downtime history to improve reliability.
WordPress downtime monitoring is the process of detecting, confirming, and tracking periods when a WordPress website is unavailable to visitors.
It is closely related to uptime monitoring, but the focus is different.
Uptime monitoring asks whether the website is reachable over time. Downtime monitoring focuses on what happens when availability breaks: how the failure is detected, whether it is a real outage, how long it lasts, which locations are affected, and when recovery is confirmed.
A reliable downtime monitoring workflow should do more than send a “site down” message. It should create enough evidence to help teams understand the incident from start to recovery.
What Is WordPress Downtime Monitoring?
WordPress downtime monitoring observes the public website from outside its hosting environment and records failures that prevent visitors from accessing the site normally.
These failures may involve WordPress itself, but they can also originate elsewhere in the delivery path.
A monitoring system may detect problems such as:
- HTTP 5xx responses
- Connection timeouts
- Refused connections
- DNS resolution failures
- SSL connection errors
- Regional network failures
- Repeated application errors
The important point is that the incident is observed independently from the WordPress application itself.
If WordPress is completely unavailable, it cannot be expected to report its own outage reliably.
For the broader availability model, see our WordPress Uptime Monitoring guide.
What Counts as WordPress Downtime?
Not every failed request should automatically be classified as downtime.
A website may briefly fail because of packet loss, a deployment, temporary resource pressure, a short CDN interruption, or a regional routing problem.
WordPress downtime generally means that the public website is consistently unavailable or returning failures severe enough to prevent normal use.
Common downtime conditions include:
- Repeated server errors
- Persistent connection timeouts
- The origin refusing connections
- DNS failing to resolve the domain
- SSL problems preventing secure access
- Broad regional or global availability failures
A single failed check is evidence of a possible problem. A confirmed incident is stronger evidence that the website is actually unavailable.
WordPress Downtime Can Happen Outside WordPress
A WordPress website depends on more than the application itself.
The public request path may include:
Visitor → DNS → CDN or WAF → Web Server → PHP → WordPress → Database and Dependencies
A failure at any of these layers can make the website appear down to users.
DNS Failure
The WordPress installation may be healthy while the domain no longer resolves correctly.
CDN or Firewall Failure
A CDN, reverse proxy, or firewall rule can block traffic before it ever reaches WordPress.
Hosting Failure
The server may stop responding because of infrastructure problems, exhausted resources, or networking failures.
Application Failure
WordPress may return server errors because of plugin conflicts, PHP failures, database problems, or deployment issues.
This is why downtime monitoring should observe the entire public result rather than assuming every outage is a WordPress application problem.
How WordPress Downtime Is Detected
External monitoring services periodically send requests to the public WordPress site and evaluate the response.
During each check, the monitoring system may record:
- HTTP status code
- Connection success or failure
- Timeout behaviour
- Response time
- DNS resolution
- SSL connection state
- Monitoring location
When a check fails, the monitoring system should treat that result as the beginning of an investigation rather than immediately declaring a full outage.
Why One Failed Check Is Not Enough
Internet-facing systems experience temporary failures.
One monitoring request may fail because of:
- Short-lived packet loss
- Temporary routing problems
- A brief application restart
- Deployment activity
- Regional network instability
If every single failure creates a downtime incident, teams quickly receive noisy alerts that are difficult to trust.
Reliable downtime monitoring therefore uses confirmation logic.
Confirming a Real WordPress Outage
Confirmation should increase confidence that the website is genuinely unavailable before the incident is treated as downtime.
Common confirmation methods include:
- Repeating the failed check
- Waiting for multiple consecutive failures
- Checking from additional geographic locations
- Comparing failure types across regions
For example, a timeout from one region followed immediately by successful checks elsewhere may indicate a regional routing problem rather than complete website downtime.
If several locations consistently fail with the same error, confidence in a real outage becomes much higher.
Multi-Location Monitoring Adds Important Context
A single monitoring location can only tell you what that location experienced.
Multi-location monitoring helps answer whether the incident is:
- Local to one network or region
- Affecting several geographic locations
- Likely connected to a CDN or routing problem
- Broad enough to suggest an origin, DNS, or application failure
This does not mean every regional failure should be classified as total downtime. It means regional evidence improves the quality of the incident diagnosis.
Downtime Monitoring Should Create an Incident Timeline
Detecting that a site is unavailable is only the first step.
Once downtime has been confirmed, the monitoring system should continue recording what happens throughout the incident.
A useful incident timeline may include:
- The first failed check
- The time downtime was confirmed
- Error types observed during the incident
- Monitoring locations affected
- Changes in response behaviour
- Recovery attempts
- The time recovery was confirmed
This history gives responders more than a binary status. It provides evidence about how the outage developed and how the website returned to service.
Track the Incident While the Site Is Down
Downtime monitoring should continue after the initial outage is confirmed.
The monitoring system should keep checking the website throughout the incident so responders can see whether the failure is stable, changing, or beginning to recover.
Useful incident data includes:
- Repeated failure results
- Changes in HTTP status codes
- Timeouts turning into partial responses
- Regions recovering at different times
- Response-time behaviour before and after recovery
These changes can provide useful clues. A site that moves from complete timeouts to intermittent 500 responses is behaving differently from one that remains unreachable from every region for the entire incident.
Confirm Recovery Before Closing the Incident
Recovery deserves the same care as outage detection.
One successful request does not always mean the incident is over. A recovering server may respond successfully once and fail again on the next request.
A monitoring system should therefore verify that the website has returned to a stable state before marking the incident as recovered.
Recovery confirmation may use:
- Consecutive successful checks
- Successful checks from multiple regions
- Normal HTTP responses
- Response time returning to an acceptable range
Once recovery is confirmed, the incident timeline can be closed with a clear start time, end time, and total duration.
Incident Duration Is More Than a Reporting Metric
A thirty-second interruption and a forty-minute outage are both downtime, but they represent very different operational risks.
Incident duration helps teams understand:
- The real customer impact
- How quickly the problem was detected
- How long recovery took
- Whether the same type of outage is becoming more severe
Duration also becomes useful when reviewing uptime performance over longer periods.
Repeated short incidents may reveal instability even when each individual outage appears minor.
Use Incident History to Find Recurring Patterns
Downtime monitoring becomes more valuable when incidents are reviewed together instead of treated as isolated events.
Historical data can reveal patterns such as:
- Outages repeatedly occurring after deployments
- Response times increasing before failures
- Incidents appearing during predictable traffic peaks
- One monitoring region failing more often than others
- The same HTTP error appearing across several incidents
- Recovery taking progressively longer
These patterns can turn downtime history into useful evidence for infrastructure, hosting, application, or capacity decisions.
WordPress Plugin Data Can Add Context During Downtime
External monitoring should remain the source of truth for public availability, but internal WordPress health data can provide useful context around an incident.
When the official plugin is connected, the latest available health information may include:
- WordPress and PHP versions
- Pending core and plugin updates
- PHP memory usage
- Database health
- Cron information
- Active plugin and environment details
If WordPress becomes completely unavailable, fresh plugin data may stop arriving. That is expected: the plugin depends on the application it is observing.
This is why plugin health signals should support downtime investigation rather than replace independent outage detection. The difference is covered in WordPress Monitoring Plugin vs External Monitoring.
What to Do After Downtime Is Confirmed
Once the monitoring system has confirmed a real outage, the next step is structured investigation.
- Review the failure type. Determine whether the monitor is seeing timeouts, HTTP errors, DNS failures, SSL problems, or refused connections.
- Compare monitoring locations. Identify whether the problem is regional or widespread.
- Check recent response-time behaviour. Look for degradation before the outage.
- Review external dependencies. Check DNS, CDN, SSL, hosting, and network paths.
- Inspect WordPress context when available. Review the latest internal health information without assuming correlation proves causation.
- Verify any corrective action externally. Do not assume a restart, rollback, or configuration change fixed the problem until monitoring confirms recovery.
Notification routing and incident communication are covered separately in WordPress Uptime Monitoring and Alerting.
Downtime Monitoring vs Site Down Notifications
Downtime monitoring and site down notifications are closely connected, but they are not the same thing.
Downtime monitoring is responsible for:
- Detecting the initial failure
- Confirming the outage
- Tracking the incident
- Confirming recovery
- Preserving incident history
Notifications are responsible for delivering the confirmed incident to the people who need to respond.
If your immediate goal is configuring delivery channels and recovery messages, see WordPress Site Down Notification.
How Watchman Tower Monitors WordPress Downtime
Watchman Tower monitors WordPress websites externally so outage detection does not depend on the WordPress application remaining available.
Monitoring checks record public availability, response behaviour, and incident state. Multi-location monitoring can add geographic context when a failure appears regional or inconsistent.
When a meaningful outage is confirmed, the incident can be tracked through recovery and connected to the site's monitoring history.
Teams can optionally connect the official WordPress plugin to add internal application context without changing the independent external availability model.
See the broader setup on the WordPress Monitoring feature page.
Detect, Confirm, Track, Recover, Learn
Reliable WordPress downtime monitoring is not a single failed request followed by a notification.
It is a continuous incident workflow:
Detect → Confirm → Track → Recover → Learn
Detect the failure from outside the application. Confirm that it represents a real outage. Track how the incident changes. Verify that recovery is stable. Then use the history to understand whether the same problem is likely to happen again.
That process turns downtime monitoring from a simple alarm into an operational record of how your WordPress site behaves when availability breaks.
Free plan available. No credit card needed.
FAQ
What is WordPress downtime monitoring?v
What counts as actual downtime for a WordPress site?v
Can WordPress downtime happen due to issues outside the WordPress application?v
Why isn't one failed monitoring check enough to confirm an outage?v
How should recovery from downtime be confirmed?v
What's the difference between downtime monitoring and site down notifications?v
Blog Posts
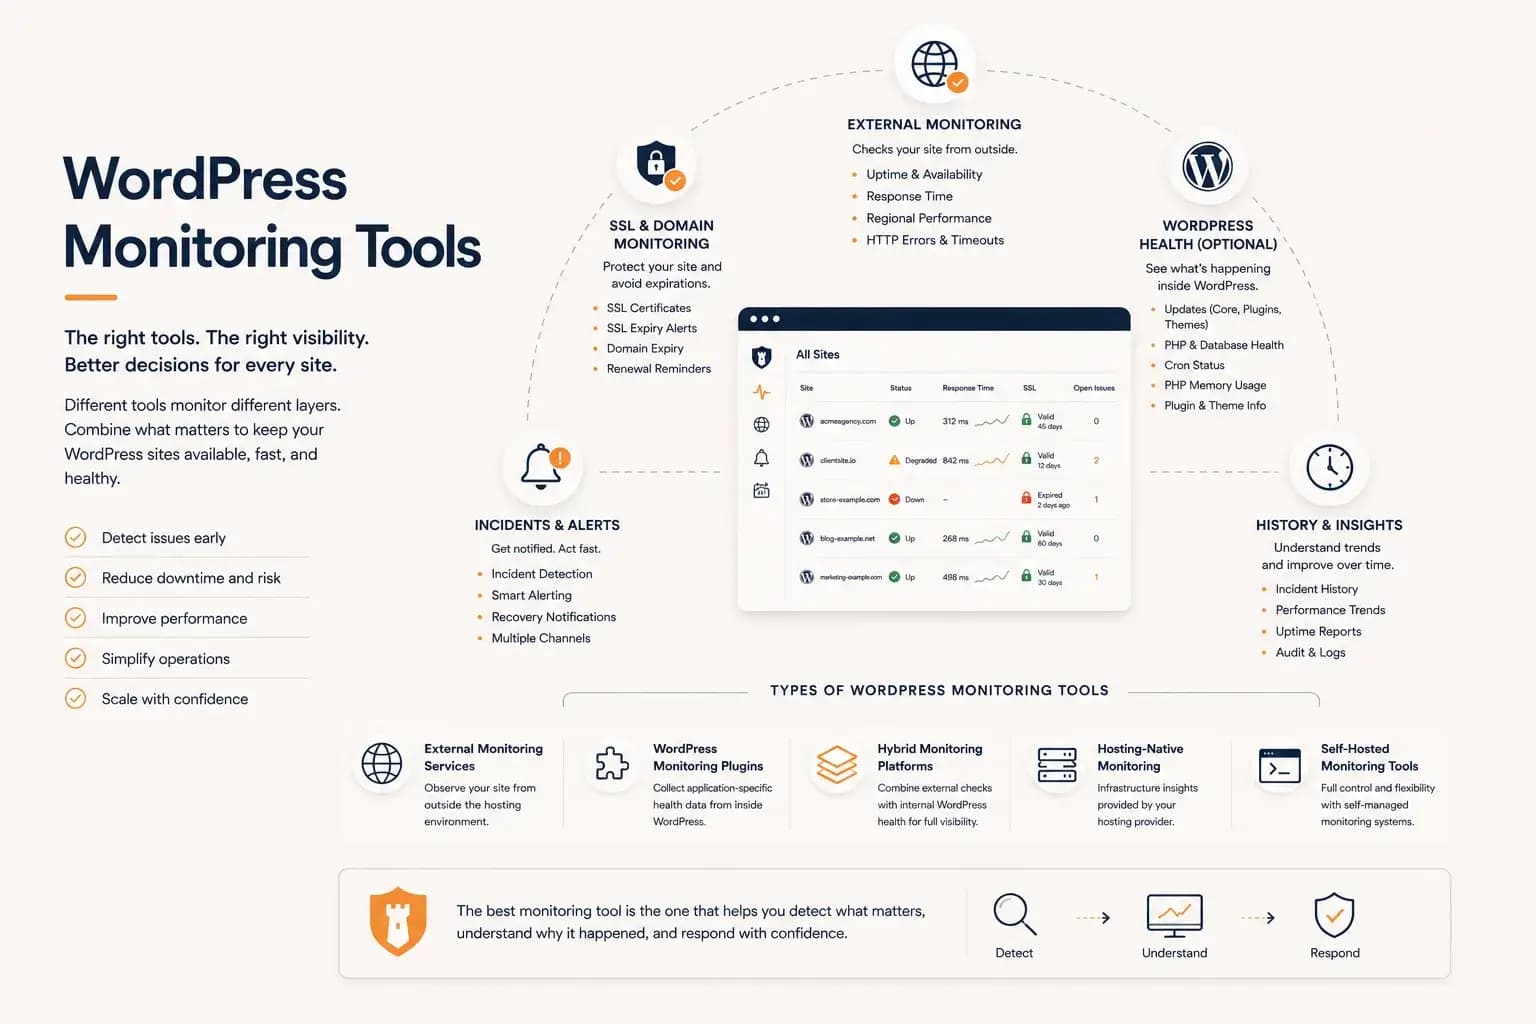
WordPress Monitoring Tools: Complete Guide...
WordPress monitoring tools include external uptime monitoring, WordPress plugins, hybrid monitoring platforms, and hosting-native solutions. This guide explains how they differ, what they monitor, and how to choose the right monitoring workflow for your websites.
Learn more about WordPress Monitoring Tools: Complete Guide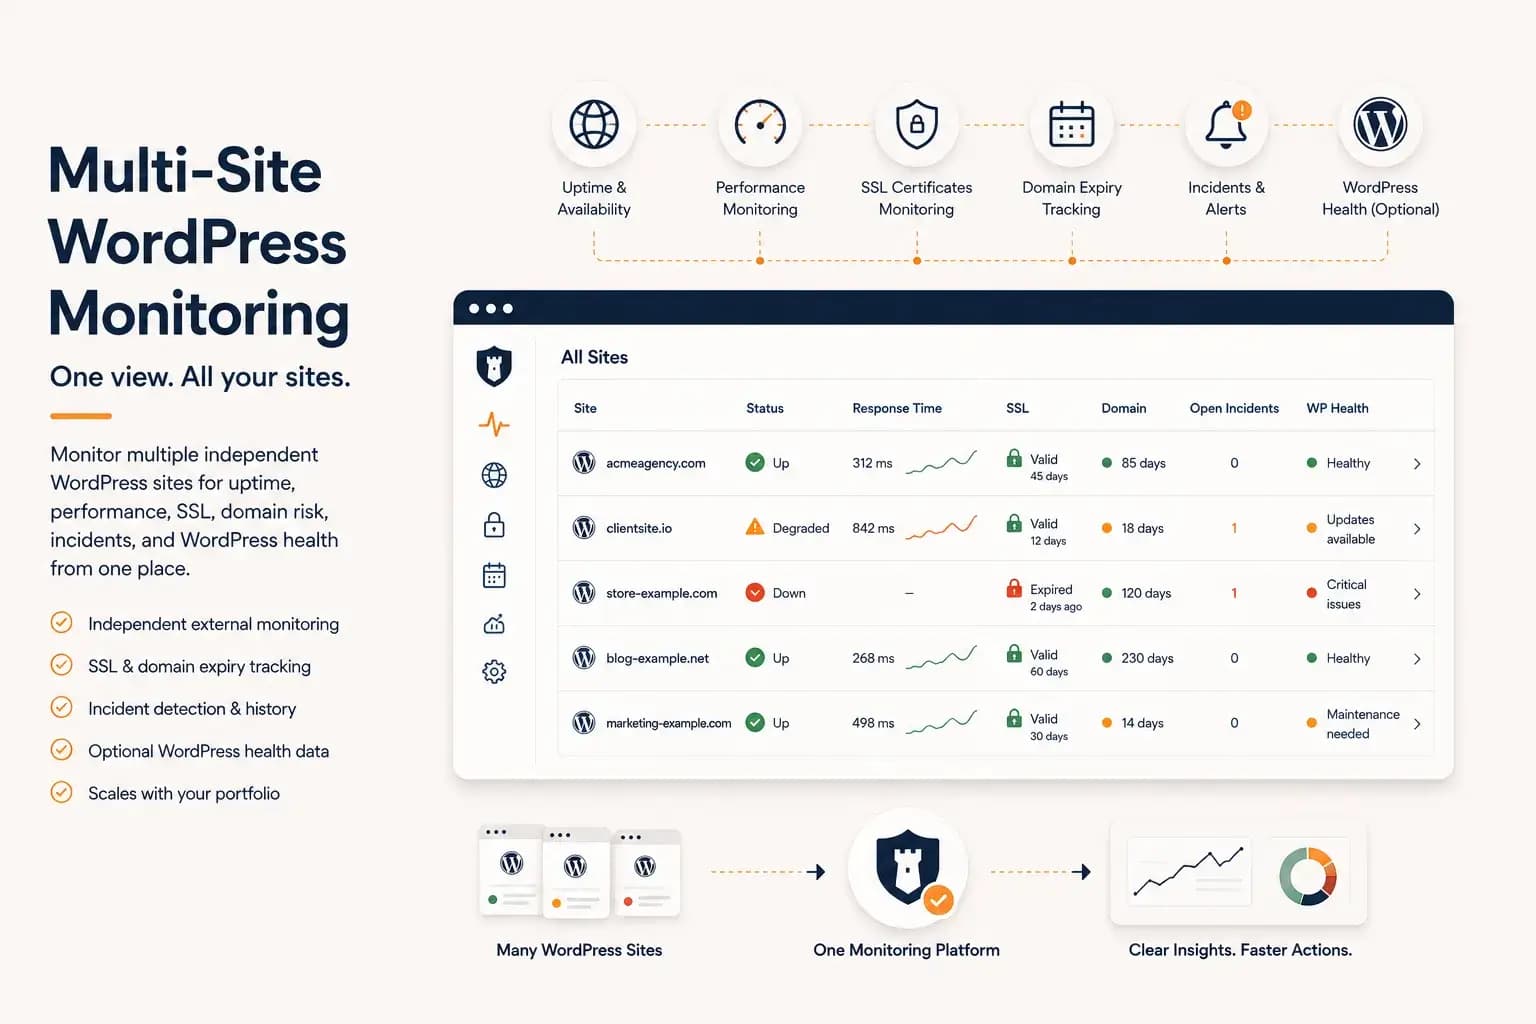
WordPress Multi-Site Monitoring: Manage Multiple Sites Efficiently...
Managing multiple WordPress websites requires more than uptime checks. Learn how to centralize monitoring, reduce operational overhead, and gain visibility into performance, SSL, domains, and WordPress health from a single dashboard.
Learn more about WordPress Multi-Site Monitoring: Manage Multiple Sites Efficiently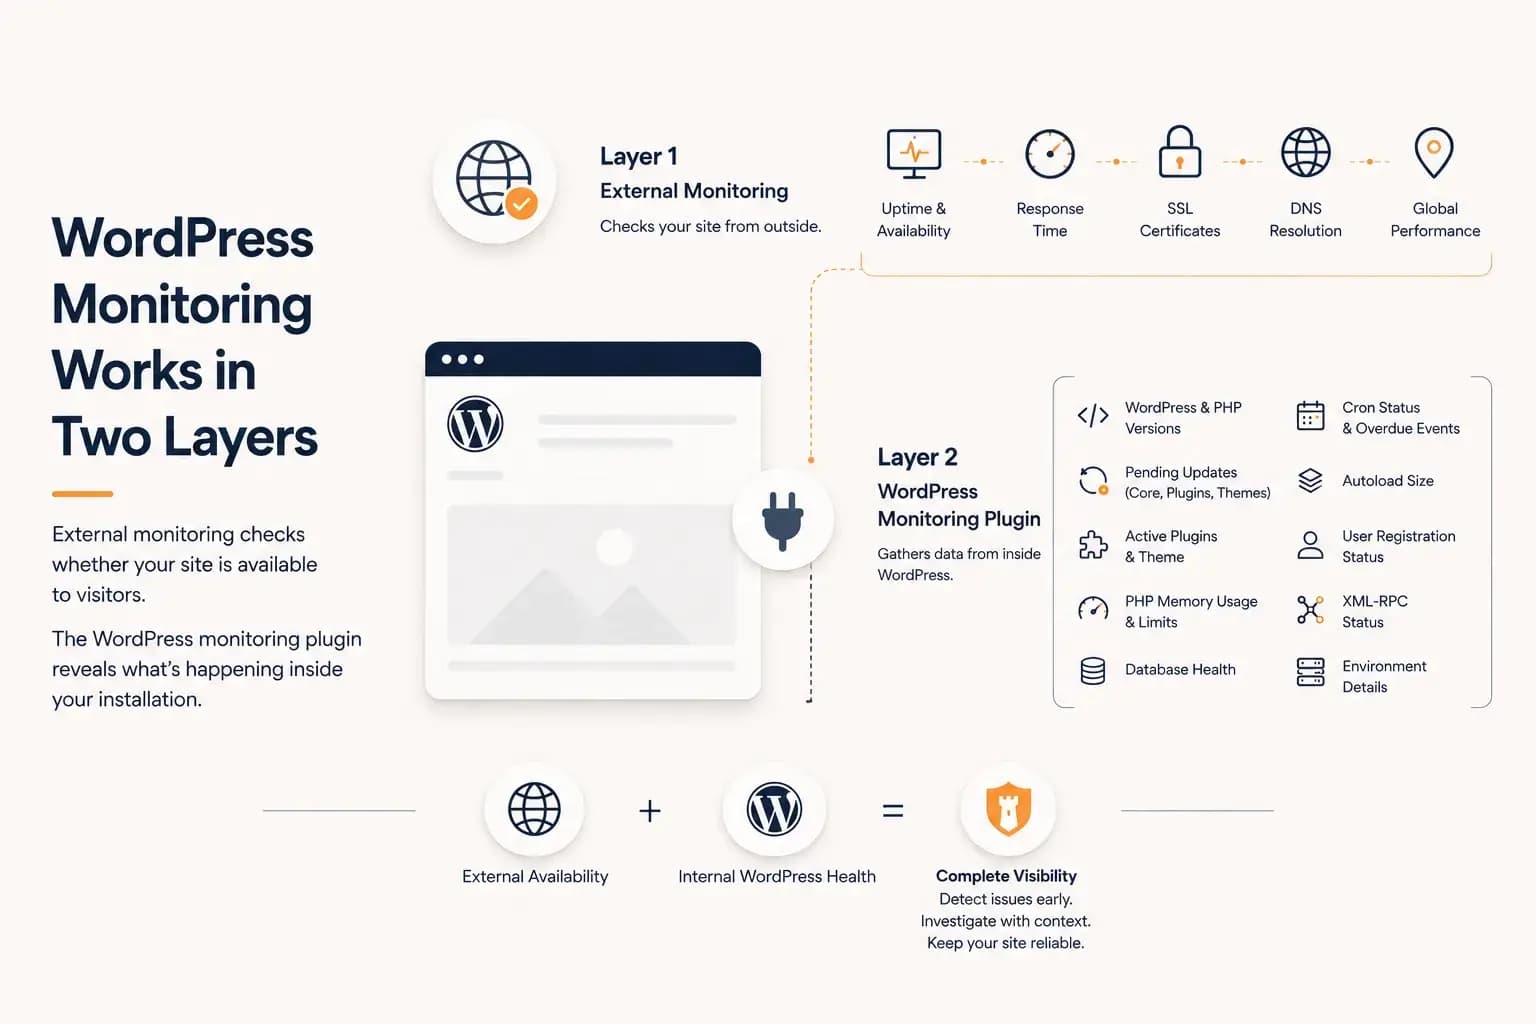
WordPress Monitoring Plugin: What It Tracks and What It Misses...
A WordPress monitoring plugin reveals application-level health such as updates, PHP memory, database status, cron activity, and plugin inventory. This guide explains what it can monitor, what it cannot see, and why it works best alongside external monitoring.
Learn more about WordPress Monitoring Plugin: What It Tracks and What It Misses